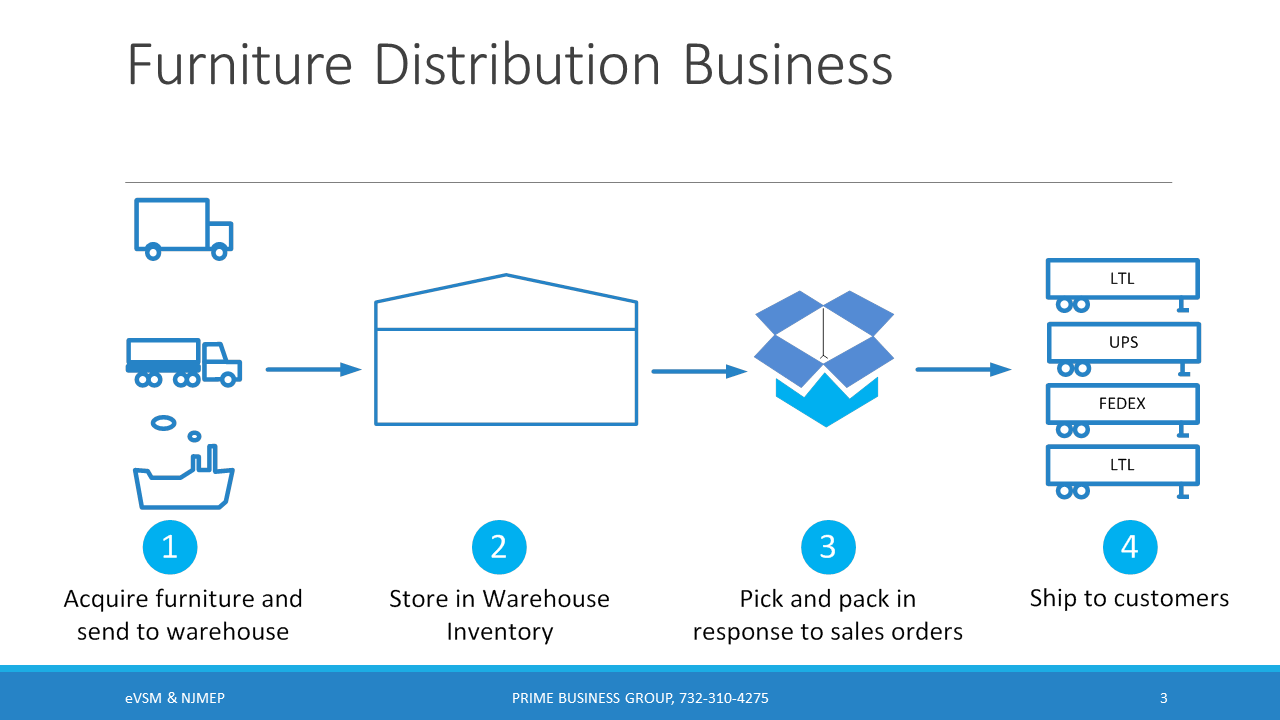
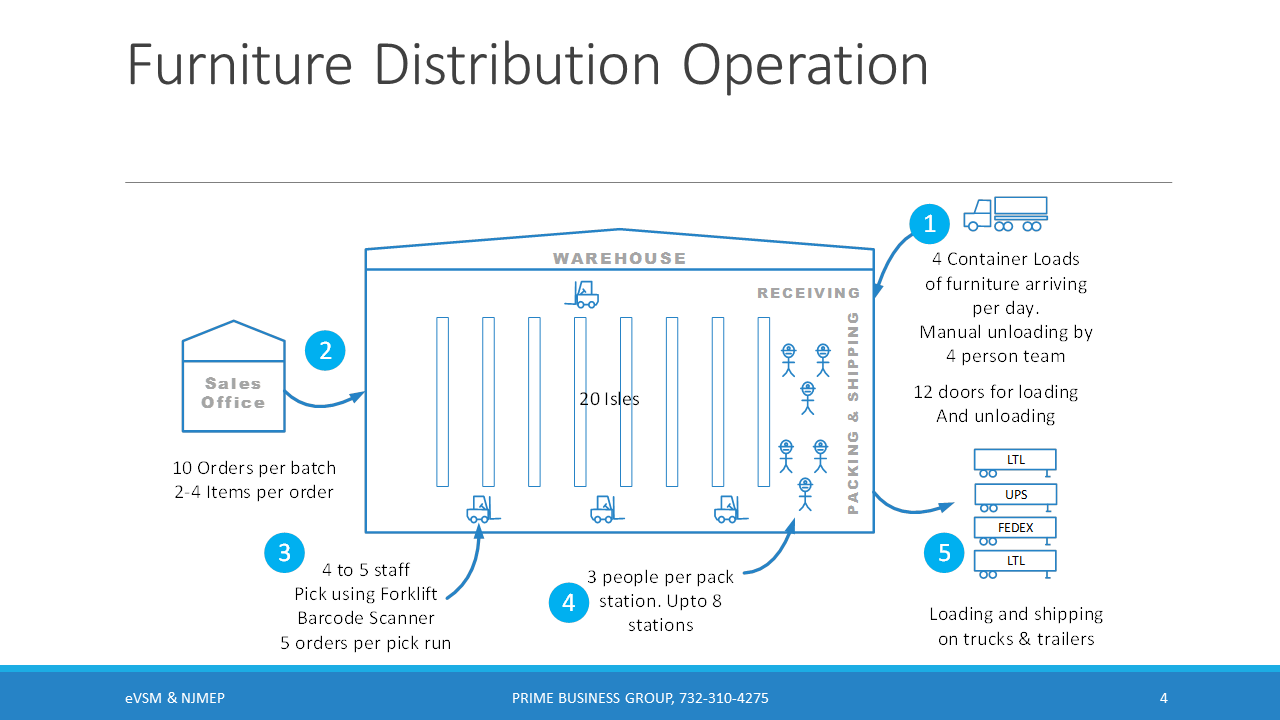
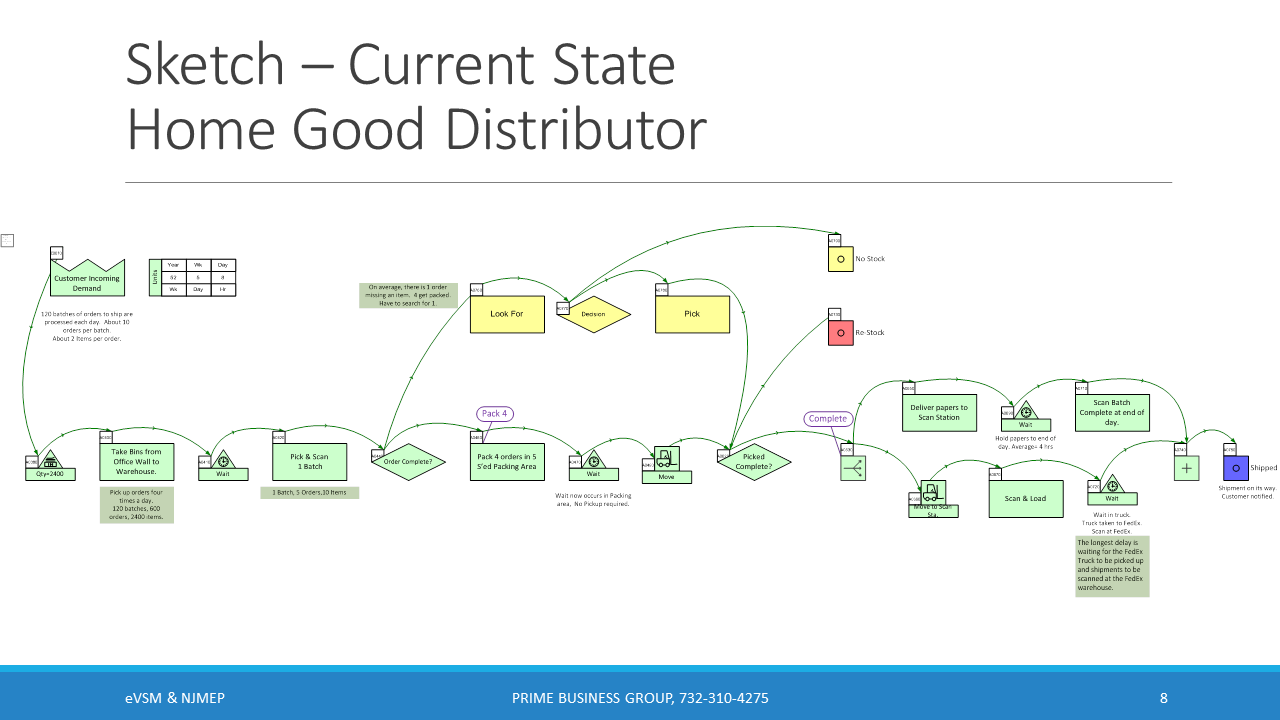
Lets look at the warehouse operation in more detail. You can see the major steps numbered in the diagrams
1. The warehouse has about 12 doors for loading and unloading. One door is used for unloading the 4 or so containers trucks coming in daily. 4 people do the unloading and it is manual because of the incoming assortment packed into the container. Speed is important to avoid demurrage charges. Items are unloaded, later moved to the back of the warehouse, and still later put on shelves when the inventory and location are updated on the computer.
2. Sales orders are brought to the warehouse in batches of 10 orders with 2 to 4 furniture items per order.
3. 4 or 5 employees use “man-up” forklifts to pick items for the orders, and, bring them to Packing Stations for packing and shipment. Usually, a batch is split when picking because of forklift capacity.
4. Packing stations are at the shipping doors and each team is manned by 3 people. There are up to 8 packing teams. Orders vary vastly. Each order is individually packed. Because each packing station has many items in multiple orders, packers must be careful to avoid mistakes.
5. Finally the order is checked, and, placed in a truck for pickup by the trucking company. Paperwork is sent to the office to wait for a tracking number.
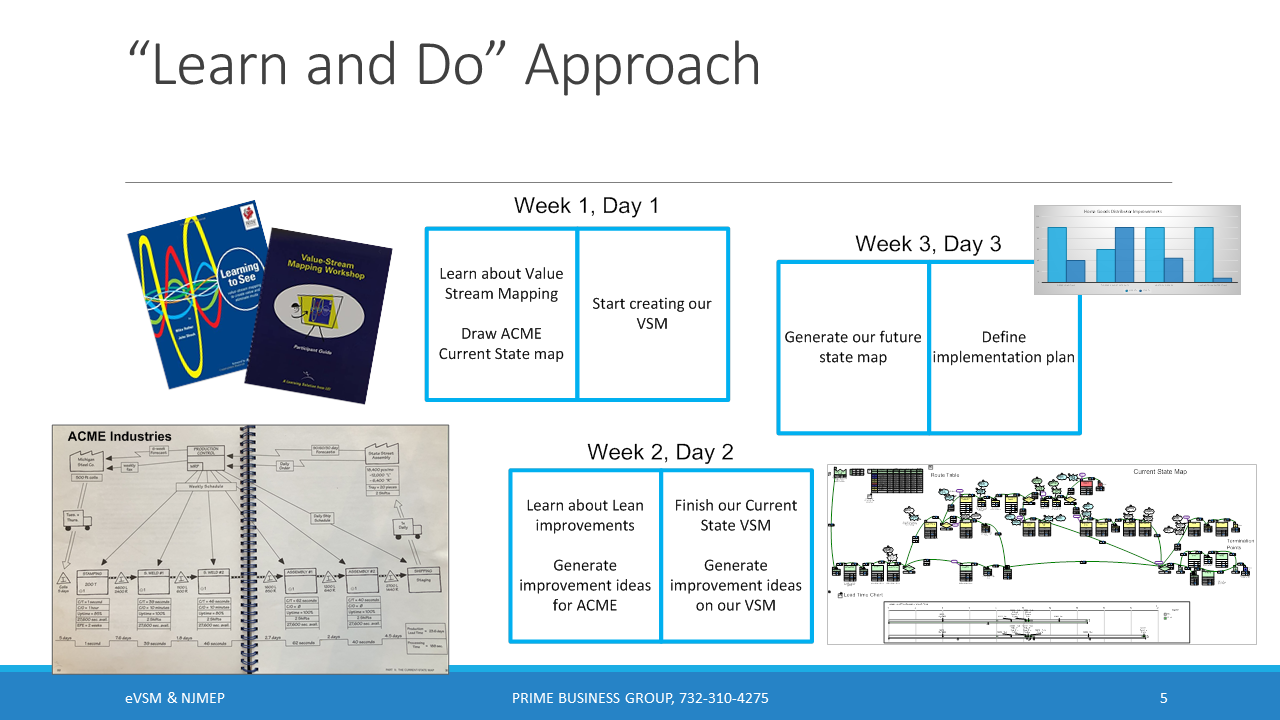
What was done to improve the operation? This slide describes the NJMEP “Learn & Do” philosophy used to educate clients about Lean. This applies to Value Stream Mapping, 5 S, and other Lean topics.
The typical class is 3 days for 10 employees. Often a client cannot afford to take people off the work floor for several days in the same week, so the usual choice is to do one class, one day per week over 3 weeks. While it is best to go out on the floor to create the Value Stream Map, the 3-day limit did not provide enough time for both education and creating a VSM on the floor. Therefore, this VSM was conducted in a classroom.
During a 3-day event, the morning is instructional, and the afternoon is devoted to creating a current state VSM. Womack’s “Training to See” workbook was used in the education. The second day is similar. The current state VSM is finished, and the class begins to offer suggestions to improve the process. This often extends to the 3rd day. If any time is left, the class works on project planning, and estimating time and cost for each suggestion. While the focus was on a VSM event we also managed to fit in 5S education and have the team apply the principles in one area. The experience of going from disorganized to organized, as always, proved rewarding for the employees, the management, and me.
NJMEP tries to include both workers and managers in the same class, often with interesting results. Both groups are usually uncomfortable discussing problems, issues, &/or opinions, which arise during any Lean discussion. And, sometimes, I have to interrupt the class and bring attention back to a fundamental cause or solution that we should be discussing. I sometimes get a comment like: “This is the first time we have all been in the same room discussing the same thing at the same time.”
At the Home Goods Distributor, the conversations were very productive. There was a lot of give and take. We did several VSMs. The company even brought 3 people from the West Coast and Chinese office to participate in a VSM class. The 5 S sessions on the floor were also very productive. After a couple of them, a Packing Station Team was selected to construct an ‘ideal” Packing Station, which was critiqued by all warehouse employees. They designated locations for each tool, every size box, and every item required for packing. The final Packing Station was subsequently duplicated across all other Packing Stations. This also meant that anyone could join any packing team and know exactly where to find anything needed.
A bonus discovery during one VSM class resulted in significant changes to the unloading process, which I will describe later.
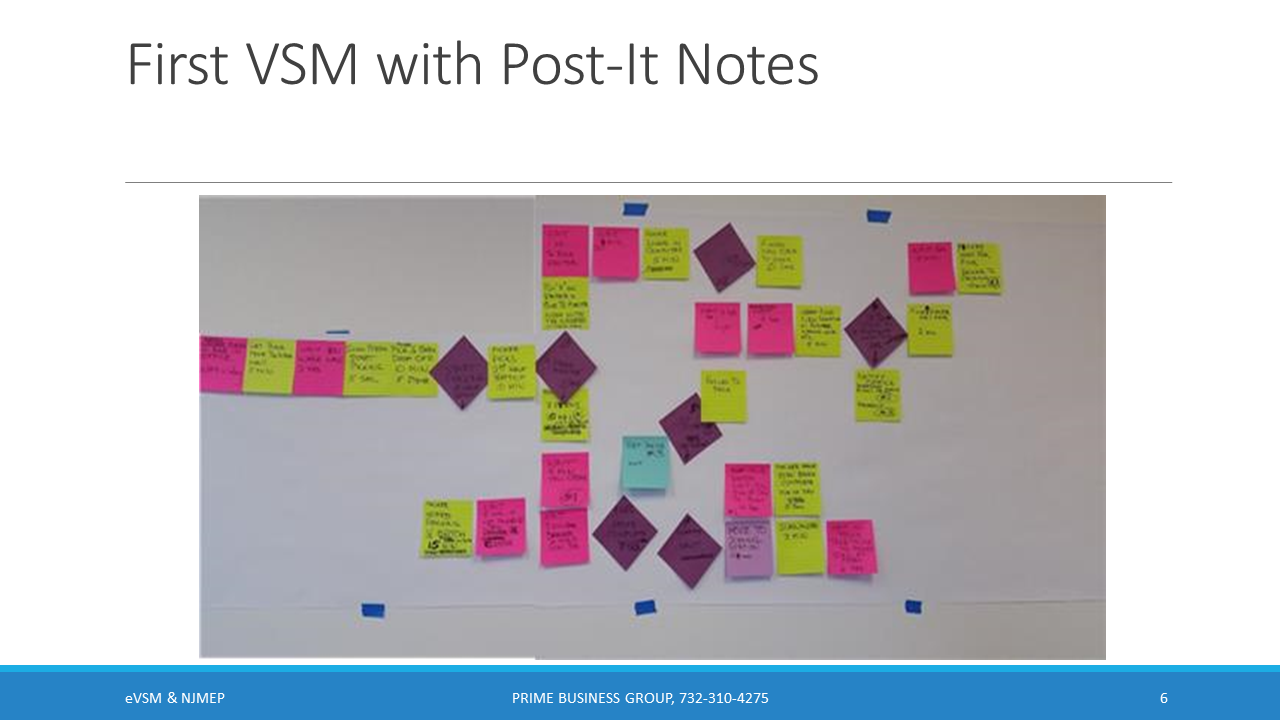
This is a photo of the original Wall map. I continue to use the old way of creating a Value Stream Map. I start with a long roll of white butcher paper taped to the wall. You can see 3 pieces of tape in the photo. As I said, I know it’s better to go onto the floor and draw the map, but the NJMEP 3-day Learn & Do time constraint forces me into a classroom setting. I begin with simple questions, filling out a Post-It, and attaching it to the paper; “How does the process start?”, “What is the next step?”, “What happens in between?”, “How much time does that take.”, and on and on. The Post-Its go up in order until someone says “Wait. Don’t we do something in-between # 4 & # 5.
When they have completely described the process, I take the roll of paper back to the office and convert it into a digitized version using eVSM software.
Before looking at a current state map, let's look at the Transactional Mapping Icons and features. These are different than the traditional manufacturing set. Then, we can look at the completed Current State eVSM.
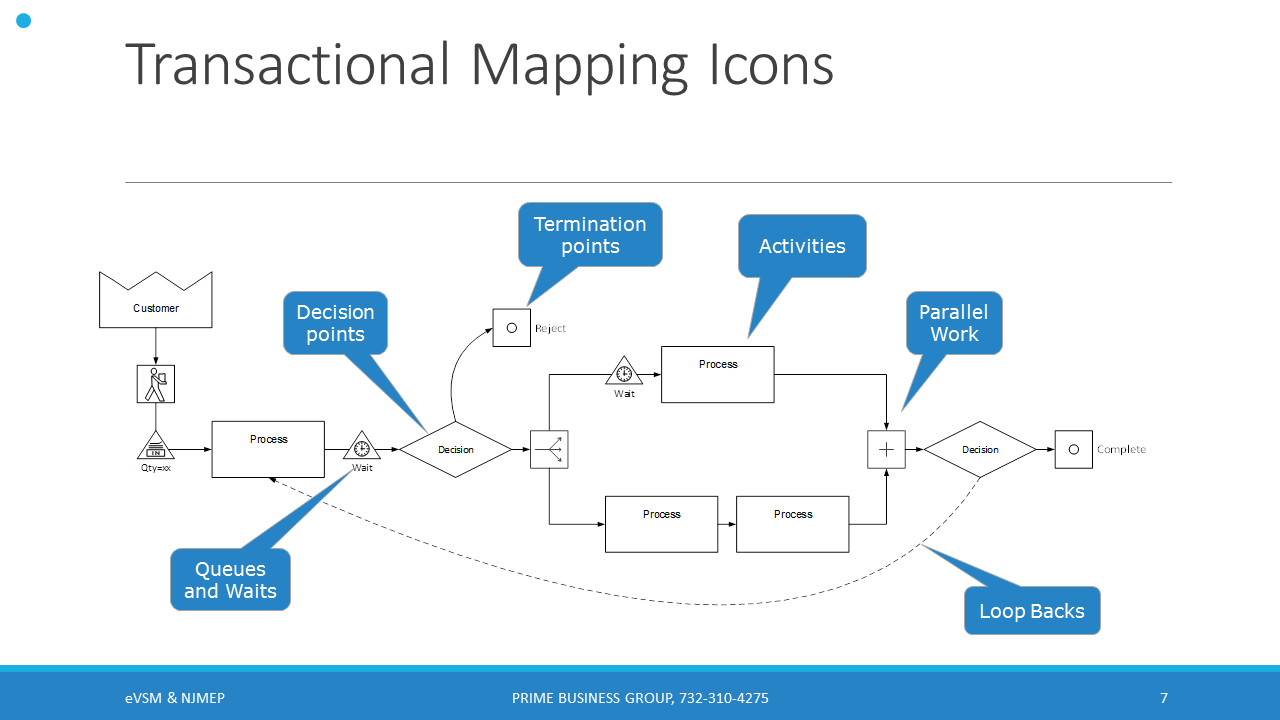
Transactional mapping combines VSM and Business Process Mapping. Let’s look at some of the icons:
Queues and Waits – Sit in a queue for your turn, or wait until the resource becomes available
Decisions – Decisions can divert traffic down different paths
Termination Points – Transactional processes can have multiple termination points
Parallel Work – Sometimes work items can be split with two or more groups working in parallel
Loop Backs – transactional processes have loopbacks with work returning to a previous stage
Now lets think about the typical analytics:
Demand and Repeat Demand: With loopbacks, decisions, and parallel work, it's not obvious what the demand is at each point. eVSM calculates it for us First time and repeat work: The effort for first time and repeat work is not the same, so we are allowed to put in two different values
Lead Time: There are multiple paths and multiple termination points. eVSM calculates what percent of items go down each path and what the lead time is for that path
Process Time and Lead Time: eVSM separates the actual work time (processing time) from the overall lead time. Something could take a day to get through a process even if it was only worked upon for 10 mins
You will see these icons and analytics applied in this case study.
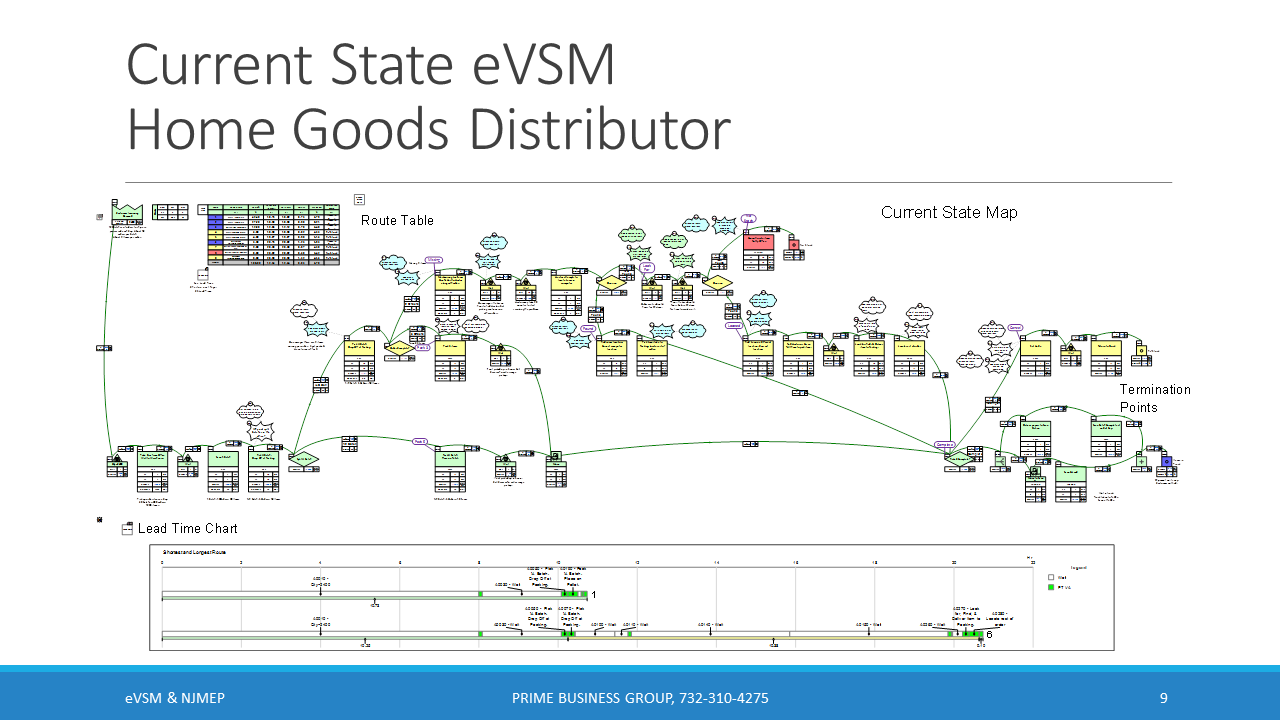
This slide shows the Current State VSM for the Home Goods Distributor.
In the upper left corner is the Customer Incoming Demand, a small rectangle for hour-minute-day conversion, and a Route Chart with different colors. Each row in the route chart names the route, shows the percent of items taking that route, and provides metrics on lead time and processing time.
There are 4 Blue Routes that result in shipment, 4 Yellow Routes that result in either a Shipment or Re-stocking and a single Red Route that ends with “No-Stock”.
Routes are a feature of the eVSM software which automatically calculates the different routes through a Value Stream Map.
Let's look at the Lead Time Chart at the bottom. The most direct route, #1 completes loading into an LTL truck in just over 10 hours. The longest route, #6, is completed in over 20 hours. Above the Lead Time Chart, is the actual, most direct route, with green icons, ending in the blue termination on the right-hand side. Routes can be animated in eVSM for clarity. The first upward excursion from the quickest route, is the beginning of a tangled web of exceptions in the process. These are illustrated with yellow icons. Some of the exceptions result in a shipment terminating at the blue icon on the right. Some of the exceptions end in re-stocking, shown with the Yellow Termination icon on the right. The longest exception route takes over 20 hours to get packed and loaded into the LTL trailers. Notice how many more steps are required. And be aware, there is lost time waiting for someone to go into the stacks and find the missing items in an order. Some exceptions end with no stock with the Red Terminator at the top to the right of the middle of the Value Stream Map.
Now lets look at the kaizen bursts and clouds on the map. A “Kaizen Starburst” is used to indicate a problem, and, attached to that, is a “Kaizen Cloud” with a brief comment regarding the potential solution. These are added to the current state Value Stream Map while suggestions and comments from employees are being made during the process of analyzing the current state. The Starburst and Cloud form the basis for creating a project task list. They are also used to evaluate the cost and risk of implementing various tasks.
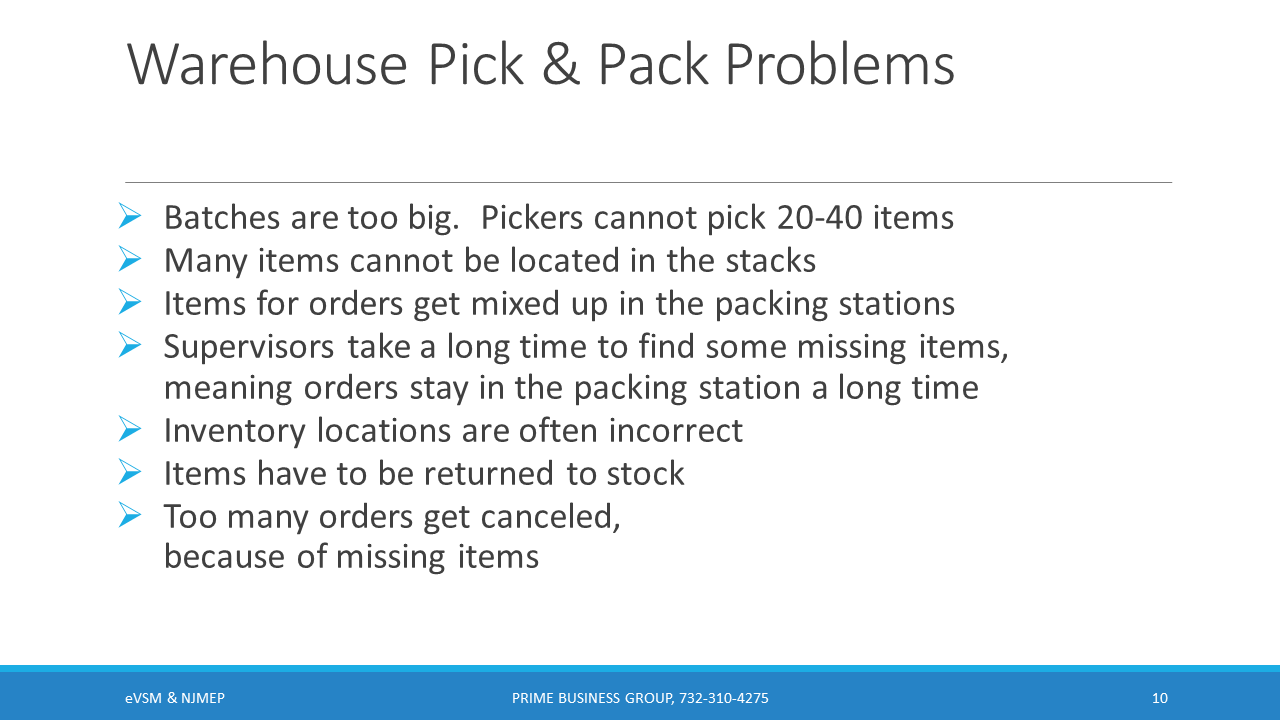
These are the major problems we discovered as we focused on the Pick & Pack processes.
It was immediately clear that a batch of 10 orders from sales were too many, and, came out too infrequently. The VP did not take long to change it to 5 orders per batch and to bring out batches from sales much more frequently.
A big problem was space. Everyone recognized that they did not have enough space, but that would not be easy to change. A part of the problem was that as Put-Away personnel put items away, they had to shove them into the space available. That often covered up items, or pushed other items into a different location, making some items hard to find. Not finding an item meant that a supervisor had to take time to look for an item to complete the order, already in a packing station.
Since a Packing Station had many items for many orders in front of a loading door, some complete, and some incomplete, items and orders often got mixed up. This means that packers have to take time to keep orders and items straight. When an order is missing an item, a Supervisor needs to go into the stacks to find it. But, since they have other duties, a particular item & order might have to wait for an hour, or more, before a supervisor can find time to find it. When a Supervisor looks for an item, they often find it in a different inventory location. They pick it, and, deduct it from inventory. The item is delivered to the Pick & Pack Station to complete packing and loading into an LTL If an item cannot be found, then Customer Service has to check with the customer. The customer can approve shipping the order short, or, cancel the order. When an order is canceled, the items in the order that were picked, and possibly packed, must now be returned to stock. More extra work.
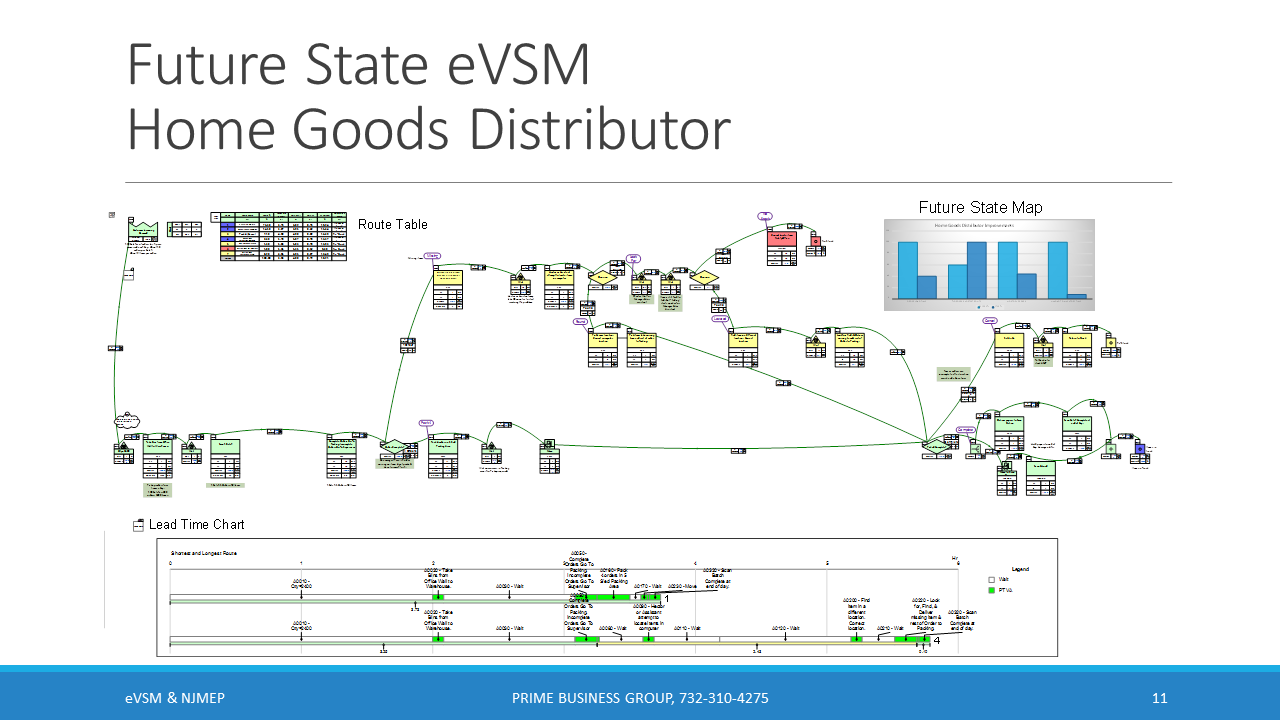
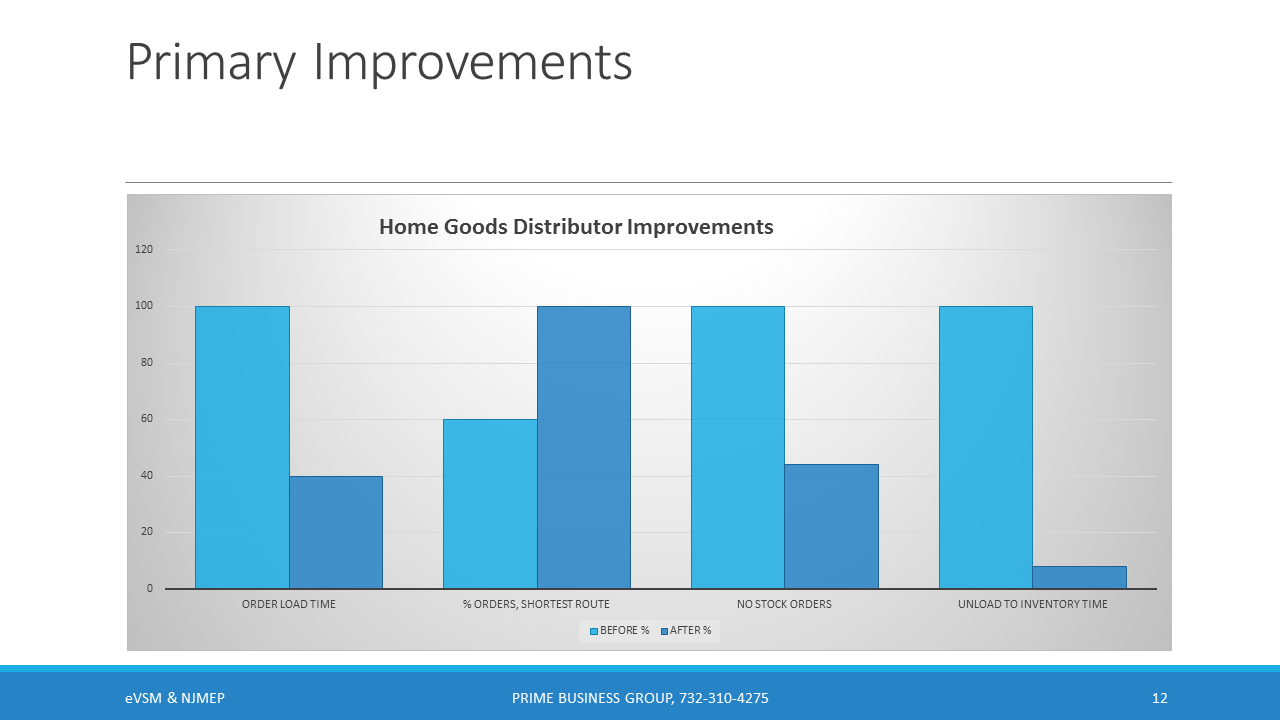
This slide shows the results achieved by employee’s suggestions on the Current State Value Stream Map, as they applied to the changes to create a Future State Value Stream Map. Let's discuss from left to right..
1. Order Load Time reduced to less than 4 hours, from 10 hours. A 60 % reduction.
2. The % of orders processed in the quickest route has increased to over 70%, from 42%. This is a 40% improvement. More orders are now in the quickest route.
3. Orders without stock decreased to 0.7%, from 1.6%, which is a 65% improvement.
4. The last set of bars shows the result of my proposal to use a “Kanban” approach to unloading. The idea was to put 12 pallets on the floor, and, have the “Put-Away” people pick up a pallet of unloaded items, and put them directly into the stacks, instead of moving them to the back of the warehouse, and then putting the items away later, when they had time. Sometimes, unloading slowed because all 12 pallets were full, but not often. The demurrage issue was not a problem because the trucking companies were not waiting for empty trailers. They picked them up at night. It was hard to believe that using a Kanban approach to unloading resulted in such a big change in updating the inventory. As a result, Unload to Inventory Time decreased to 2 hours, from 24 hours, an astounding 92 % improvement.
These are some of the “Takeaways” from this case study project. We all know Lean can be applied anywhere, but this illustrates one more case where it worked, and worked well.
At first, both employees and managers were ill at ease with each other. But quickly, they became a group working on a problem. Everyone worked toward the common objective of understanding and then solving problems.
Using Post-It notes for a VSM is still a valid method of creating a conference room Value Stream Map. Its easy to move them around. Everyone can see how the process is developing.
Transactional Mapping was easy to apply. Less data meant that the team could focus on the process. The map provided valuable metrics and visuals.
Giving employees the responsibility to create their own Packing Station was quite a surprise to them. After initial wonder, they tackled the job and then accepted suggestions from their peers. The result was another successful 5S project implemented at all Packing Stations.
Hopefully, this case study will be a useful example for you to use in the future. My contact info and some useful links are below.