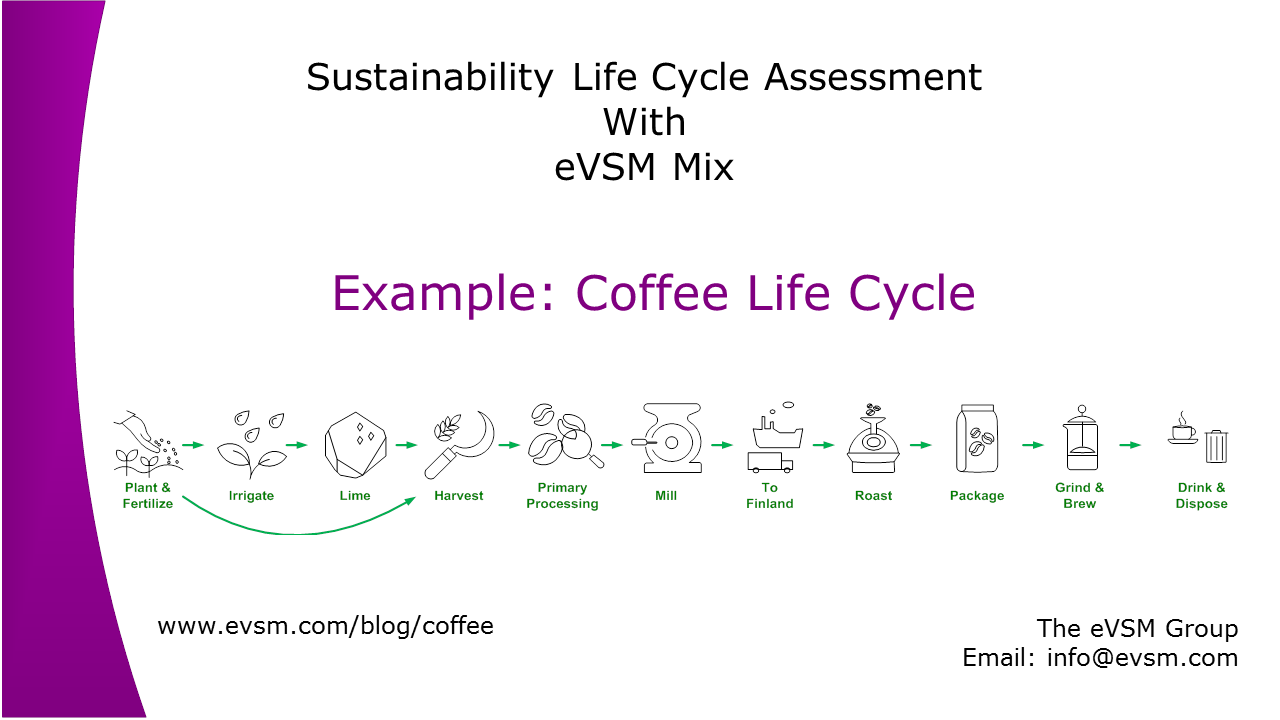
We are excited to announce a new capability for sustainability mapping with eVSM Mix LCA. This product is at beta release stage. We will introduce the capability via an application to greenhouse gas emissions and water usage in the coffee life cycle from planting to disposal
Emission calculators are increasingly available for activities we engage in like transportation, production, and disposal. The next challenge is to map these point calculations together into life cycle assessments so we know the total emissions per product and can strategize where to make the next improvement on our journey to net zero emissions. eVSM Mix LCA is well suited to this task. Let's see how.
Emission calculators are increasingly available for activities we engage in like transportation, production, and disposal. The next challenge is to map these point calculations together into life cycle assessments so we know the total emissions per product and can strategize where to make the next improvement on our journey to net zero emissions. eVSM Mix LCA is well suited to this task. Let's see how.
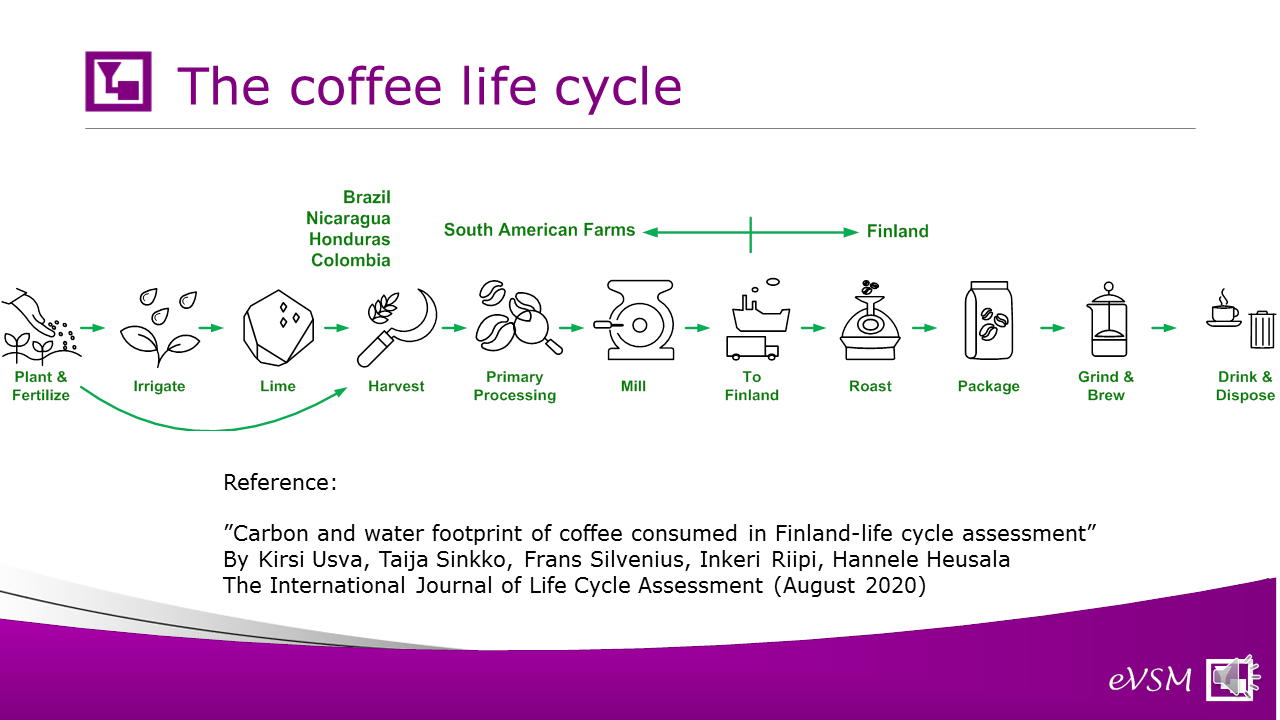
We will use a coffee life cycle as our case study and you see the main steps here. We have used approximated data and life cycle info from the reference shown.
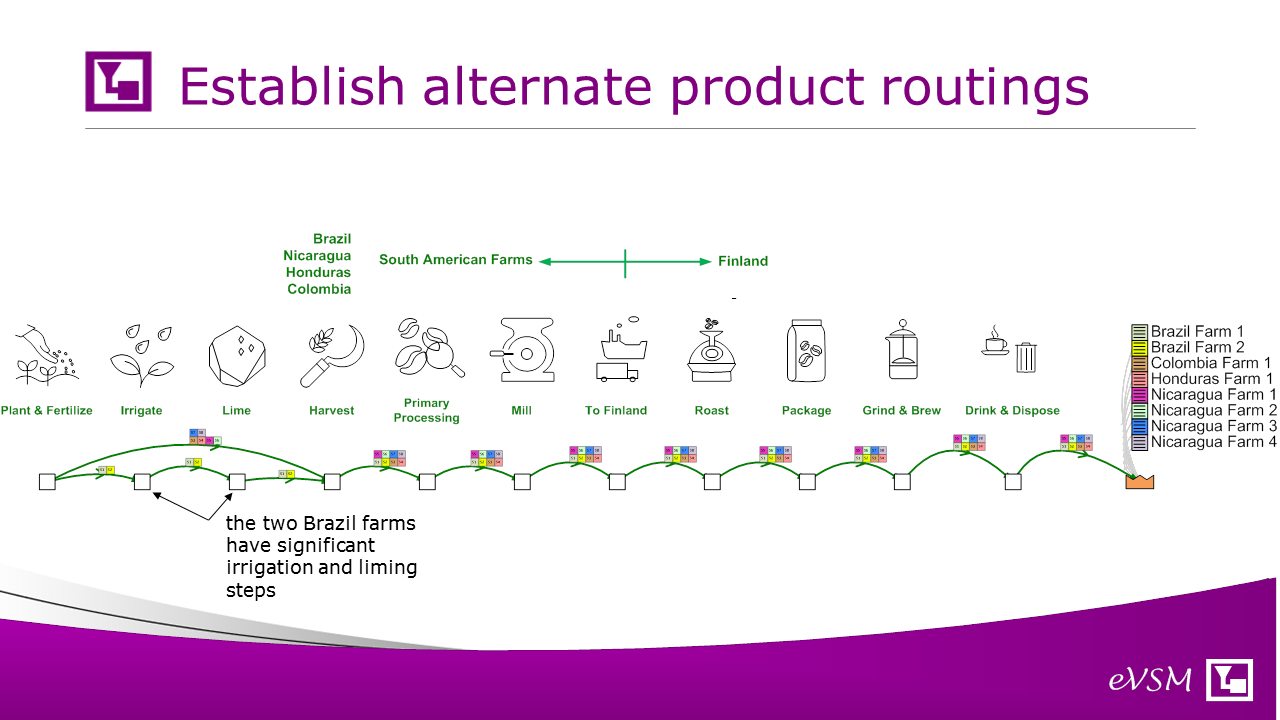
There are 8 farms providing coffee in the value stream and they are shown on the right. The routing through the steps can be different for each farm and this is color coded on the map.
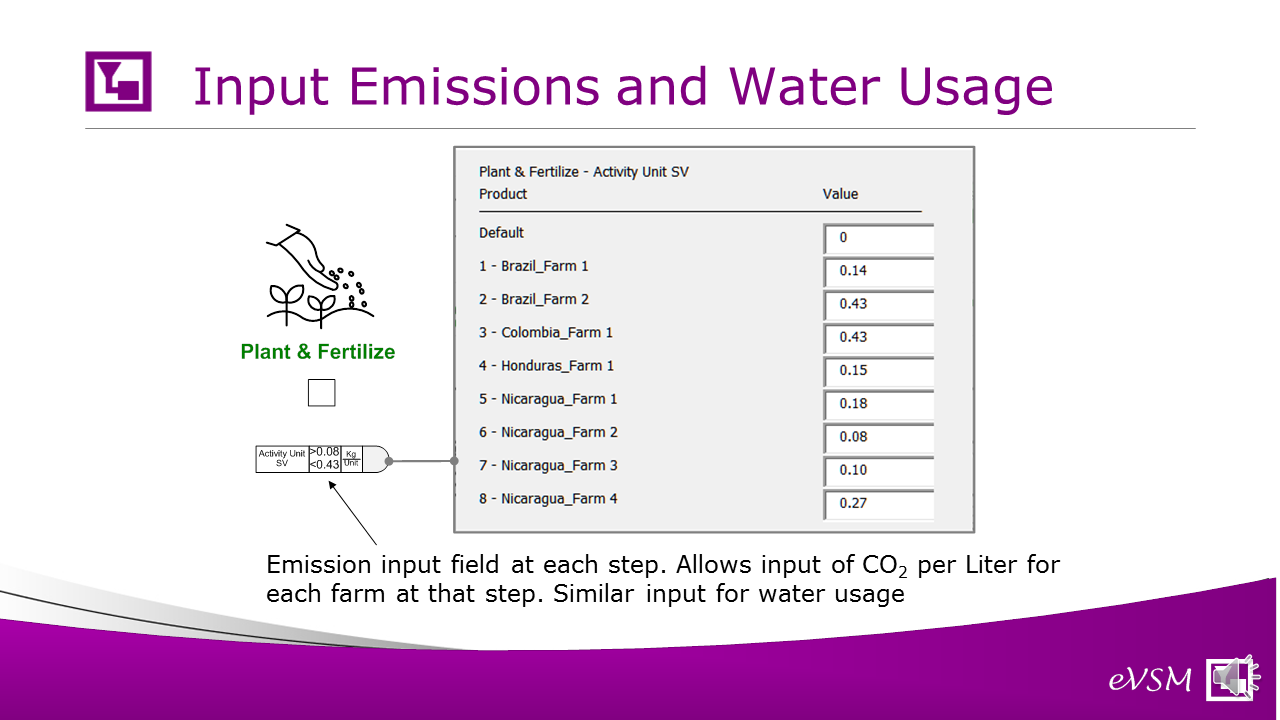
The emissions (per liter of coffee) and water usage vary by farm for each step. We can enter these either via a form or a spreadsheet.
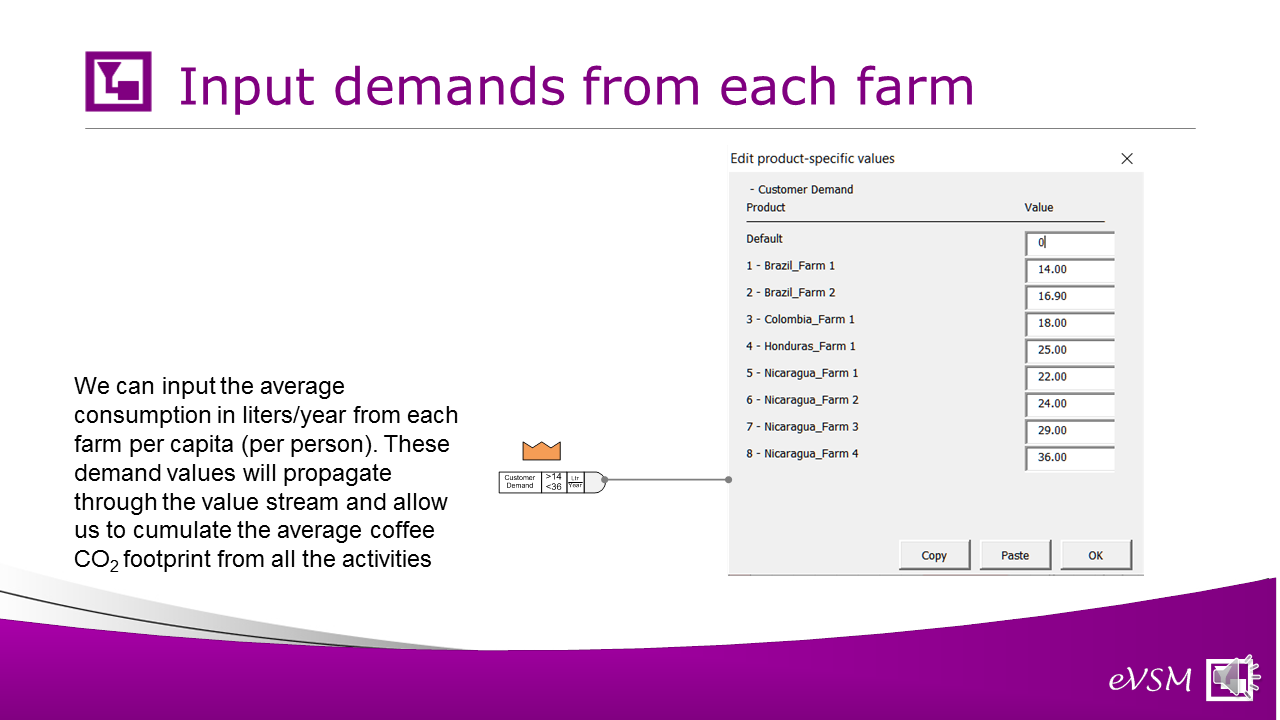
The current demand (coffee liters per year) varies for each farm. We can enter the demand values here
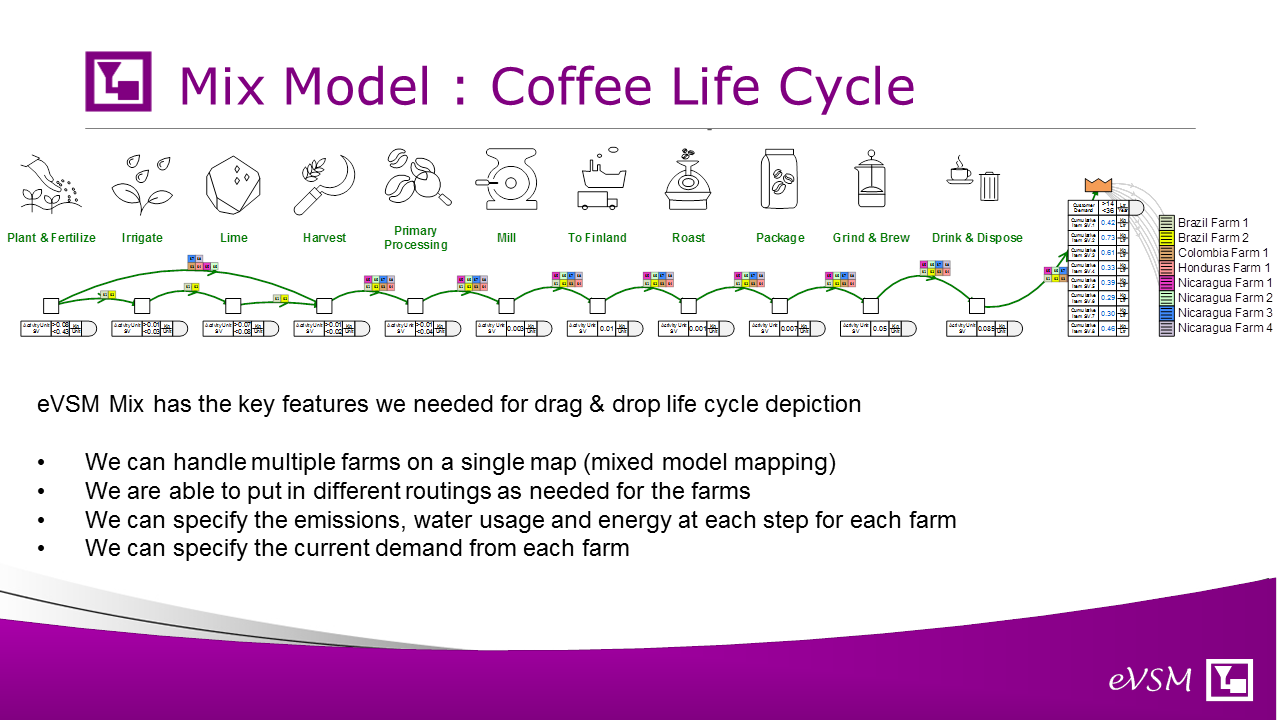
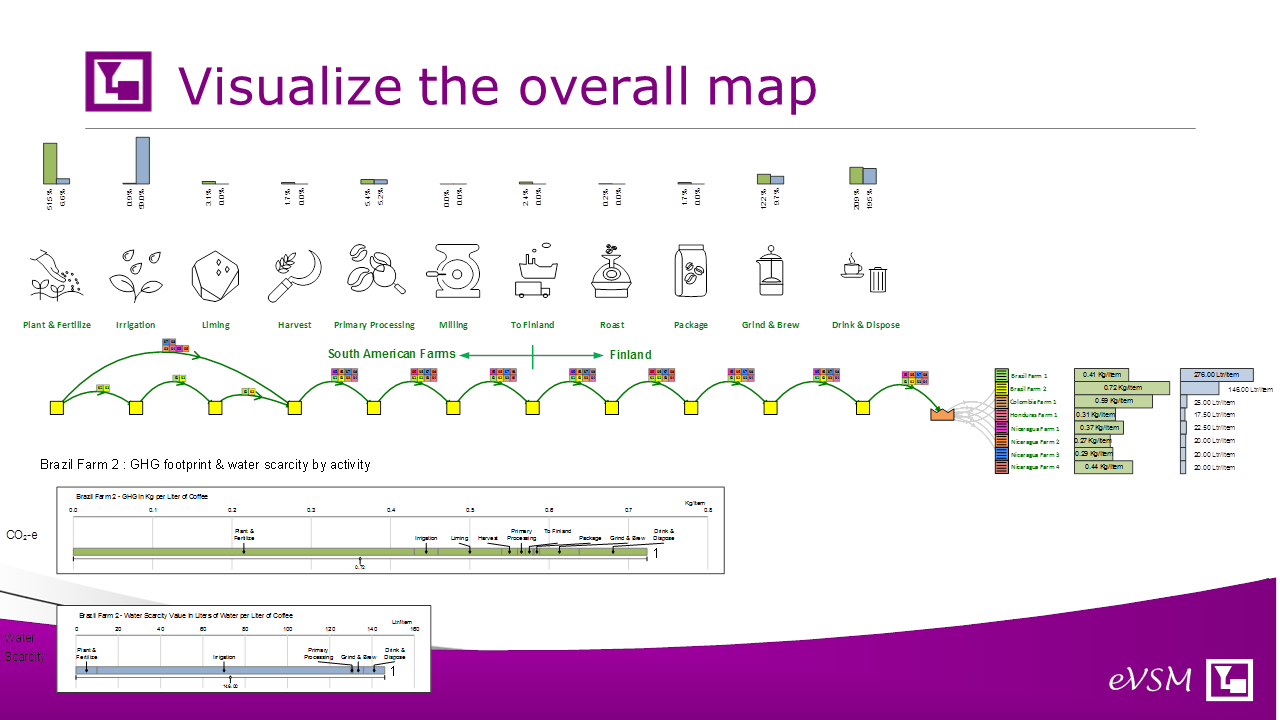
The eVSM Mix engine is well suited for life cycle depiction and the map after input data is shown here with the key features that made mapping simple. Lets see how we can use the map to do life cycle calculations next.
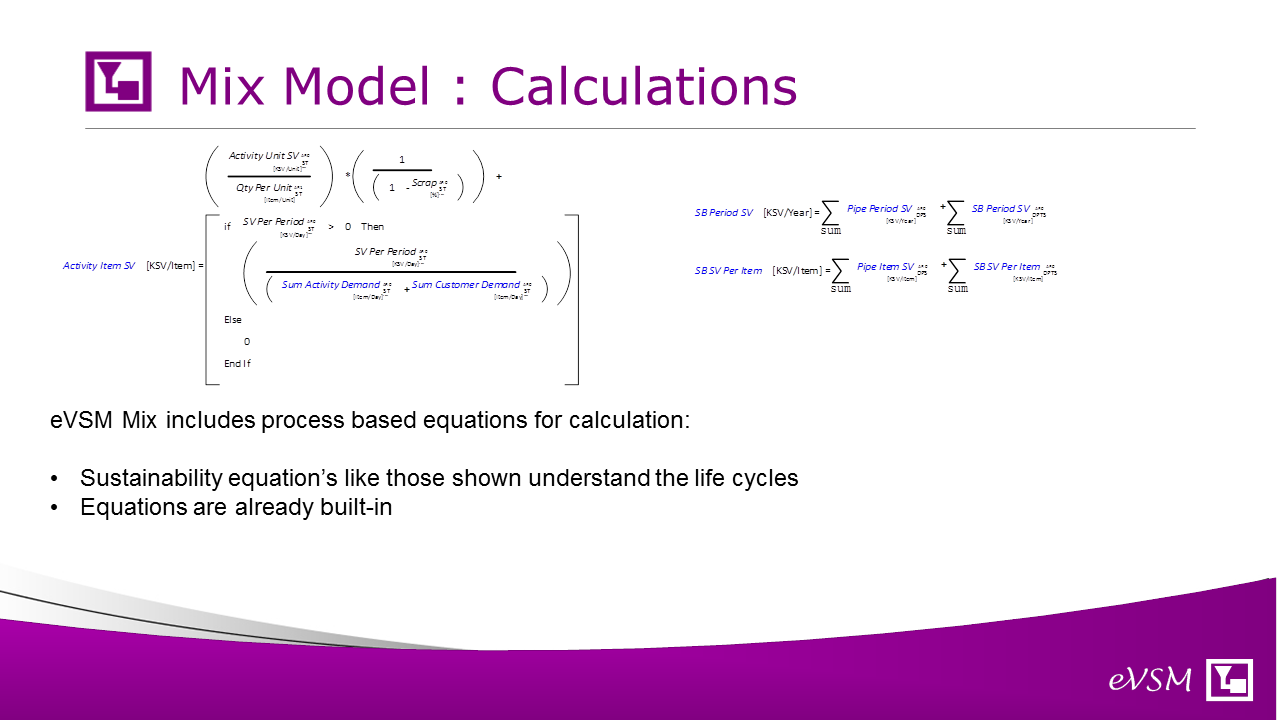
The eVSM Mix engines include equation capability that understands life cycle mapping and the networks involved. Equations to do sustainability calculations are already built in.
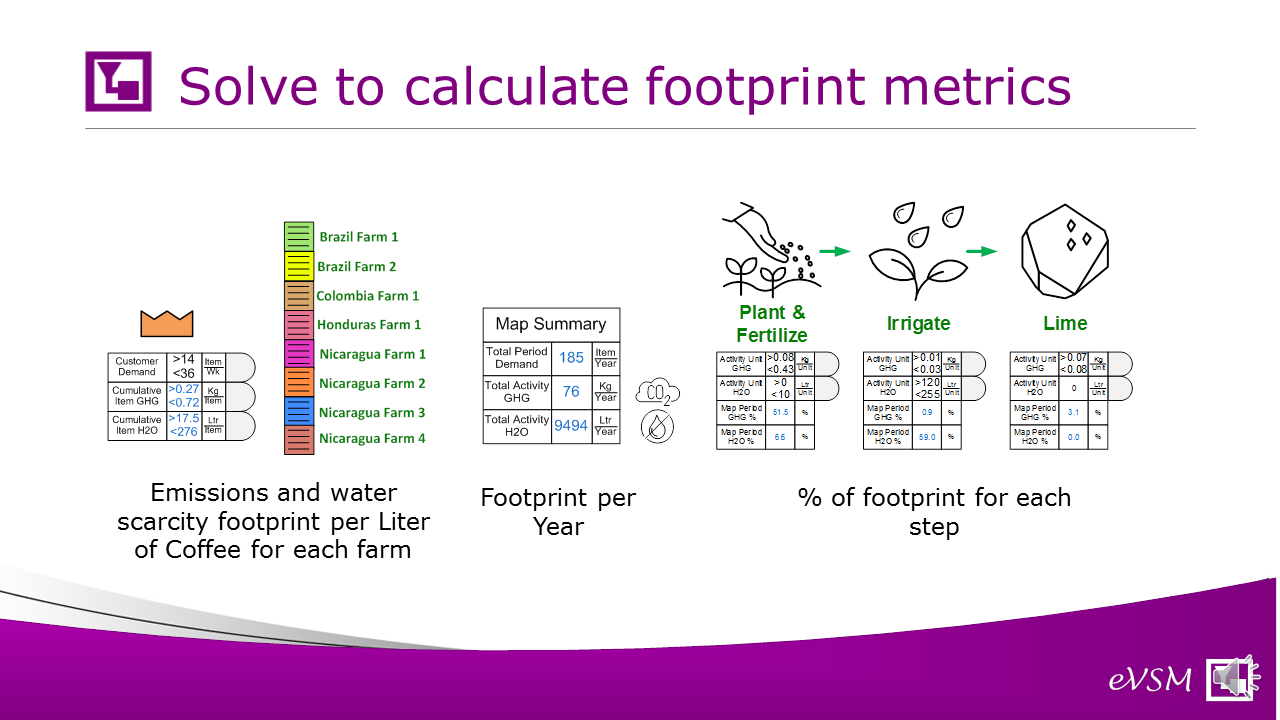
We can now solve the map using the built-in equations. This gives us overall emission values by farm, by time period and for each step.
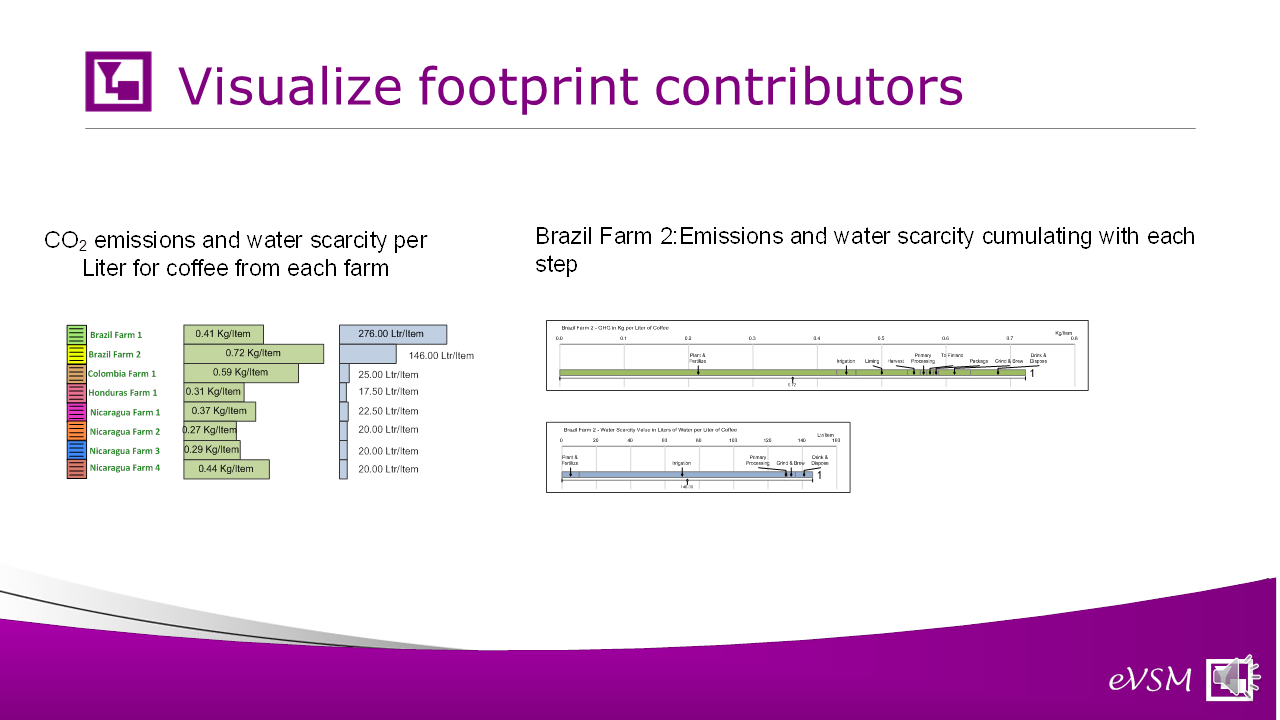
The footprint values calculated can be visualized through gadgets and charts. We can compare the footprints per farm, per step and also see the footprint makeup for a farm.
We can use the visual map to draw high-level conclusions
1. On the top, we can see that plant/fertilize, Grind/Brew & Drink/Dispose are the big contributors to the footprint
2. On the right we can see that it really matters where we source the coffee. Brazil Farm 2 has 2.5x the carbon footprint per Liter than Nicaragua Farm 2
3. On the bar charts for Brazil Farm 2, We can see the contributions to emissions and water usage. Irrigation is the dominant factor for water usage.
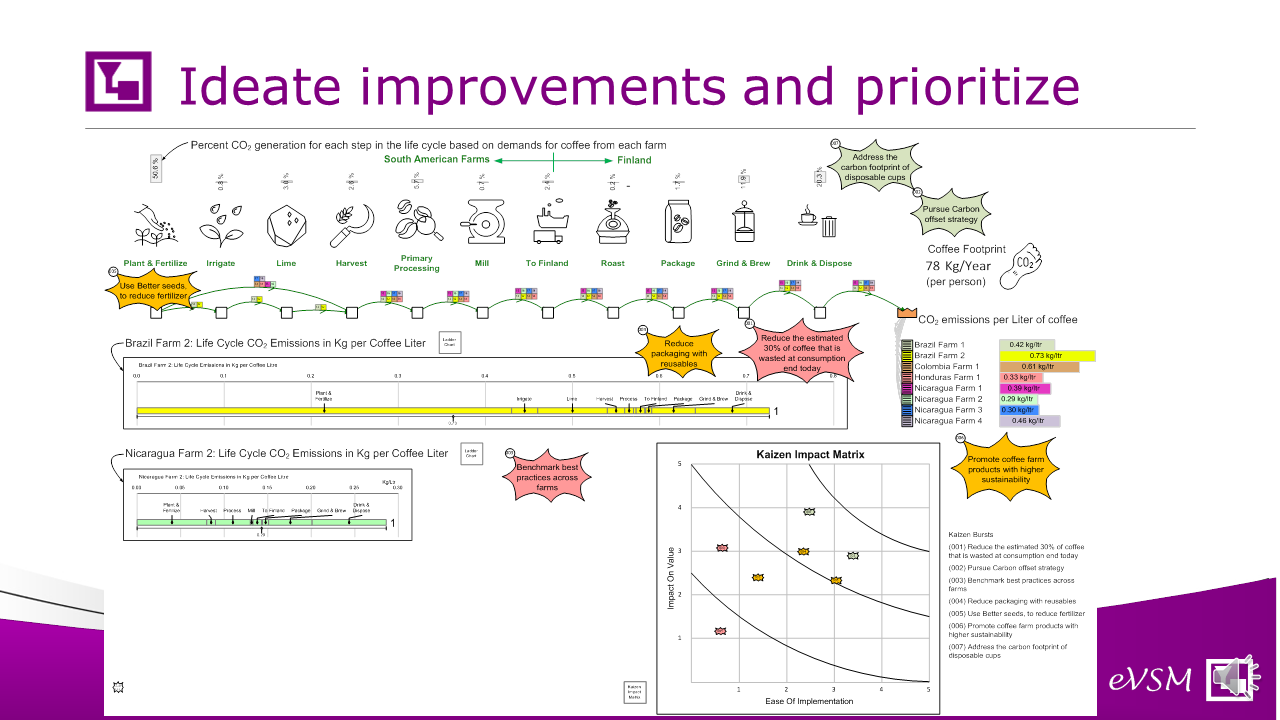
The map can be shared to generate Improvement ideas and these can be prioritized based on impact and difficulty.
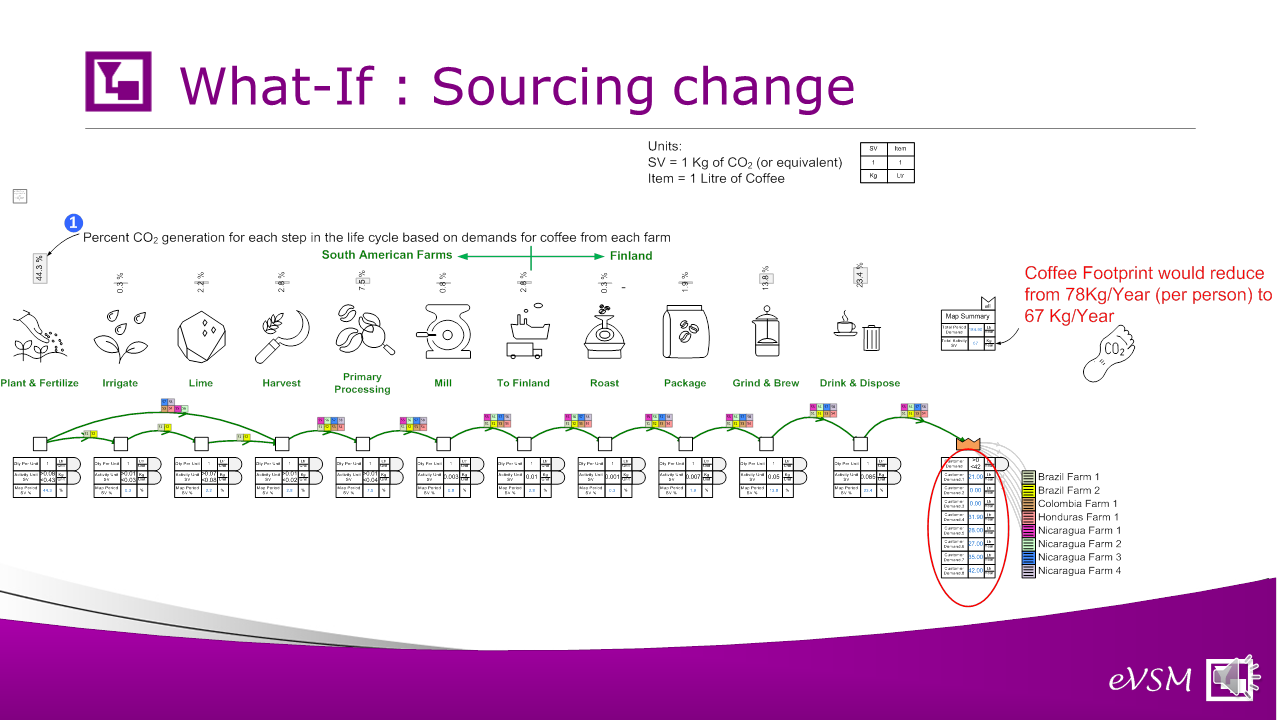
We can do what-ifs with the map. What if we eliminate the highest emitting farm life cycles and spread the demand to the others?
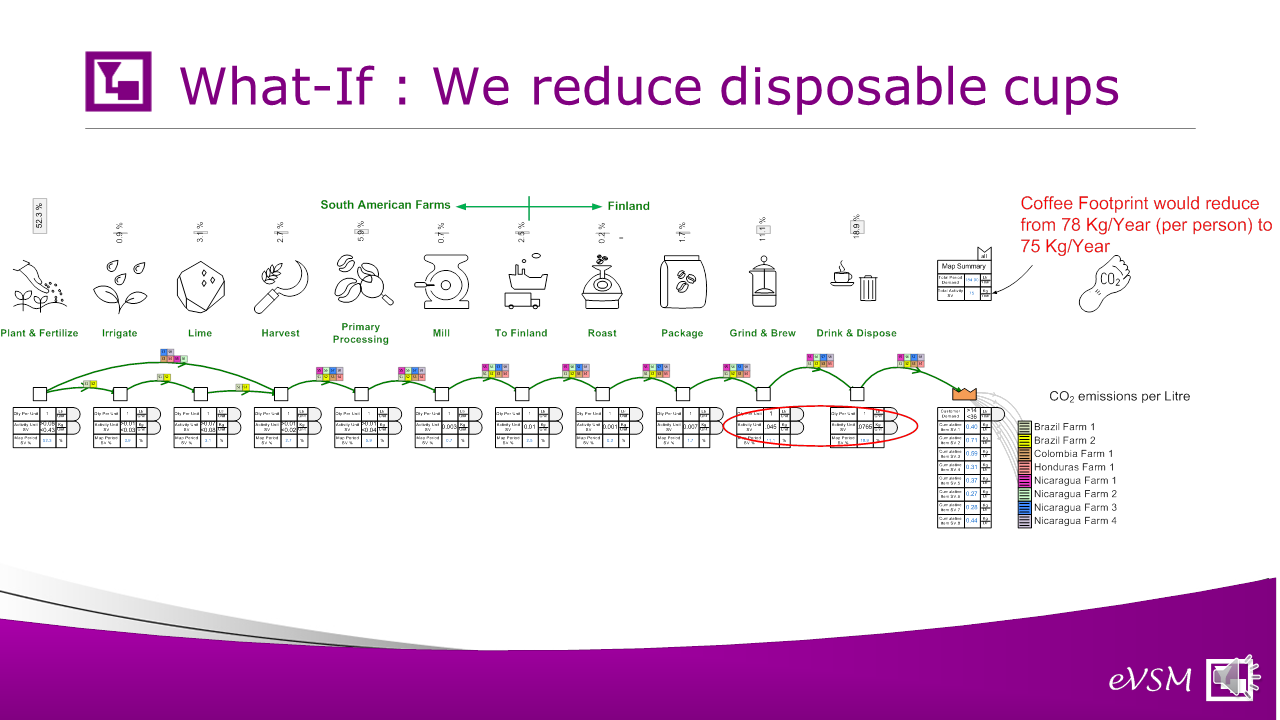
What if we reduce our usage of disposable cups, thus reducing emissions by 10% at the consumption and disposal stage?
Our work on this case study has shown that the enhancements we have made to the software for sustainability work well and that the eVSM Mix engine is ideally suited for creating life cycle maps and visualizing sustainability components and impact.
Please contact support@evsm.com to learn more
Please contact support@evsm.com to learn more