This blog is based on a live webinar given by our guest presenter, Nancy Such on Line balancing
You can see Nancy's lean background above. She is an experienced lean practitioner and facilitator that we have know for many years. She is also an expert eVSM user.
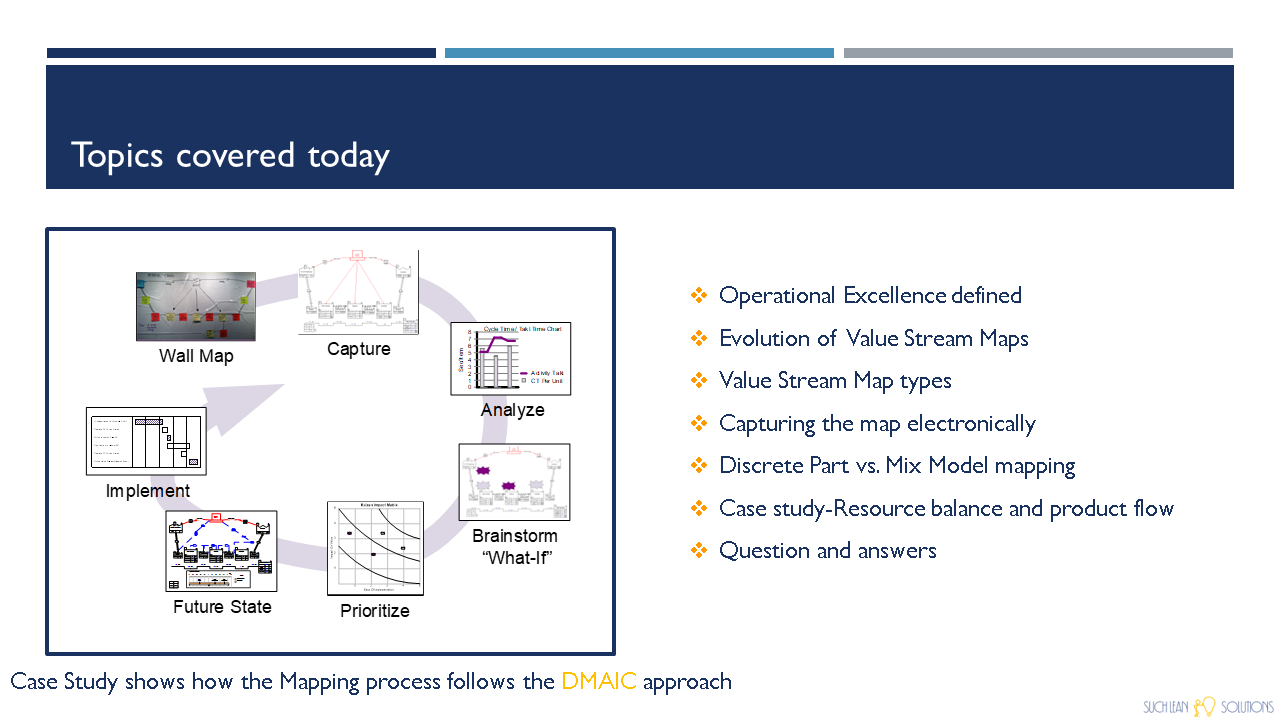
Our presentation today will walk through Operational excellence defined, evolution of a value stream map, capturing the map electronically and how it supports the entire mapping cycle. We will touch on the difference between discrete part mapping and mix model mapping, and the case study will reflect how Value Stream Mapping fits so well into the DMAIC process..
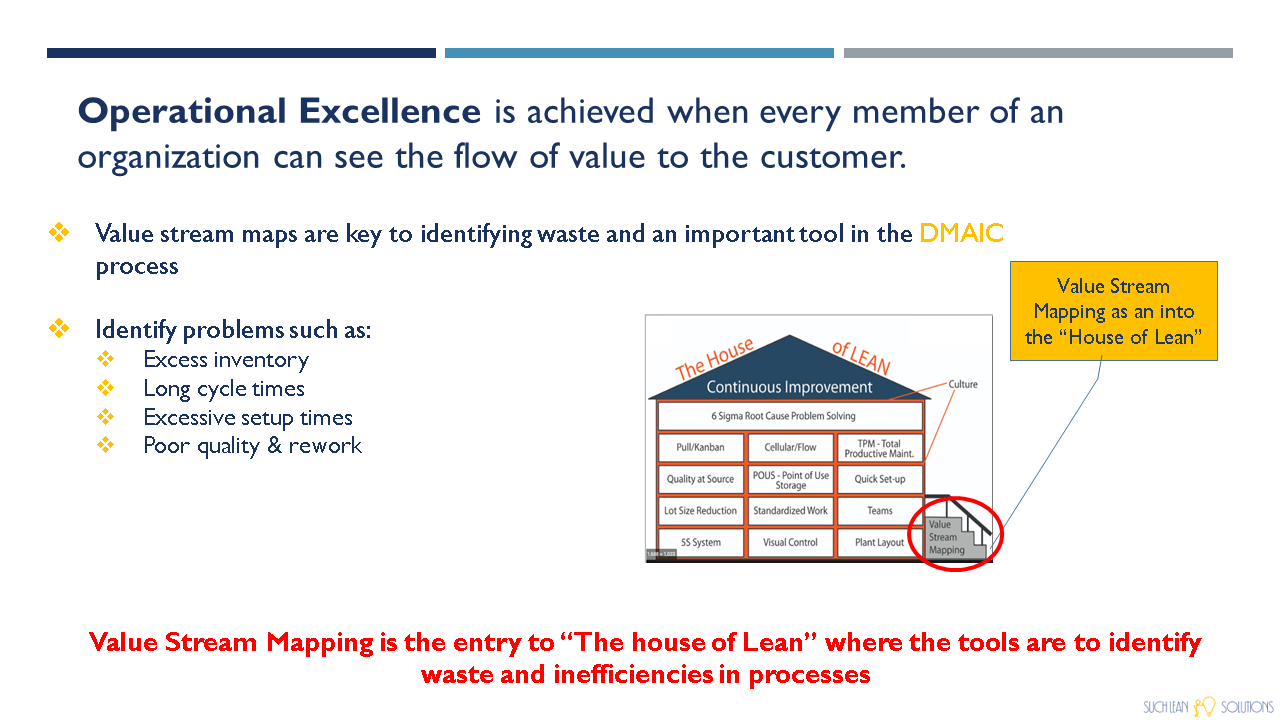
How do you achieve Operational Excellence? It happens when every member of your organization can see the flow of value to the customer. Value stream maps are the first step in identifying waste and presenting the process in a format where the flow is visible. The map allows us to identify problems such as excess Inventory, long cycle times, excessive set ups and if the map is set up by function it allows us to view and potentially balance our labor resources.
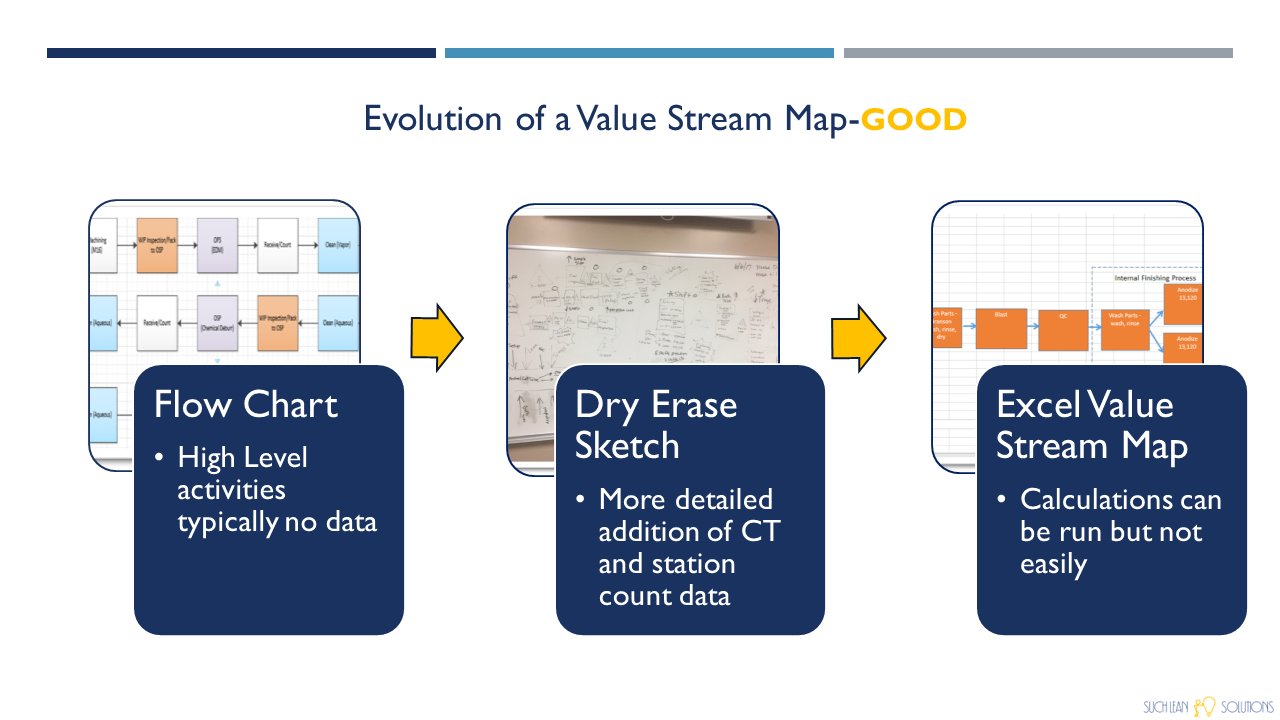
With most processes there is more than likely a Flow chart- That gives us high level activities with no data.
From the flow chart a dry erase sketch is often made ñ That provides room to add data and manually calculate.
The sketch can be entered in excel and data calculations can be calculated. Its good right?
From the flow chart a dry erase sketch is often made ñ That provides room to add data and manually calculate.
The sketch can be entered in excel and data calculations can be calculated. Its good right?
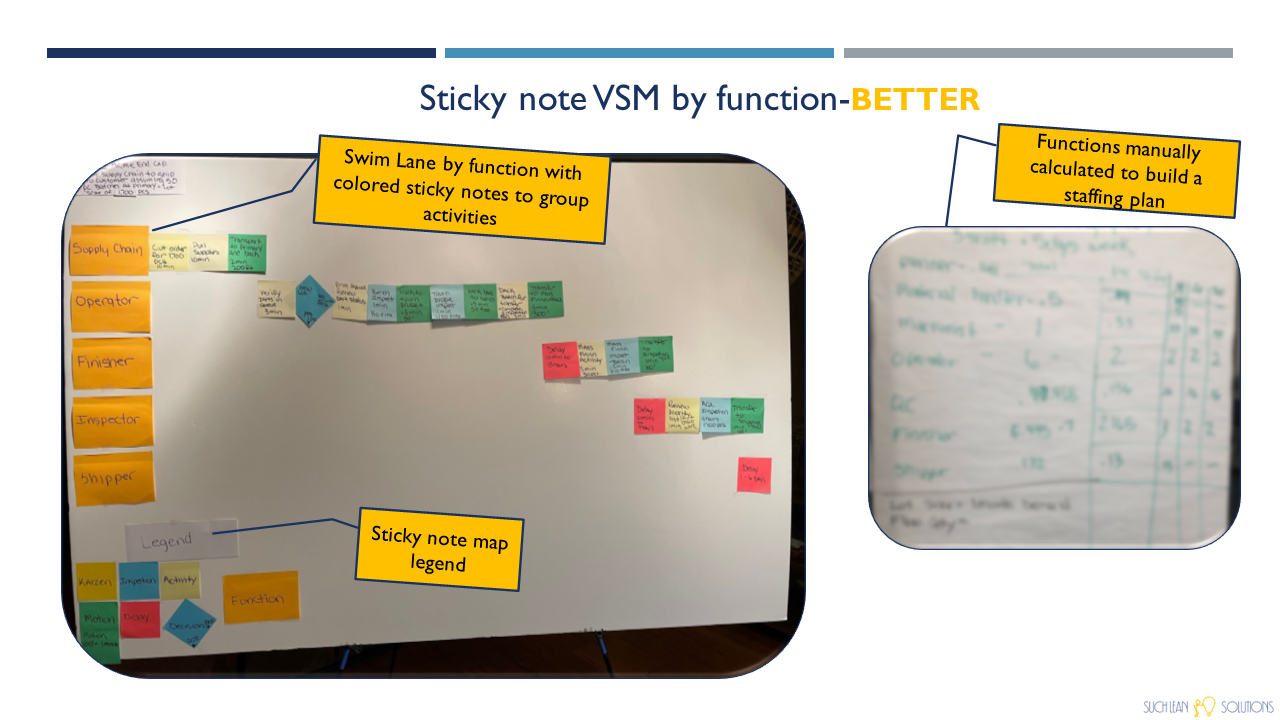
We can take it a step further with the Sticky note value stream map. This allows for identification and calculation of time by function and activity.
In this example the large gold notes are the function. The smaller notes are organized by color as shown in the legend. ñ Action, inspection, motion, decision point and delays are all reflected.
Once the map is complete the activity times can be added up and understood enough to develop a staffing plan for the line. Thatís better and perfect for the current state.
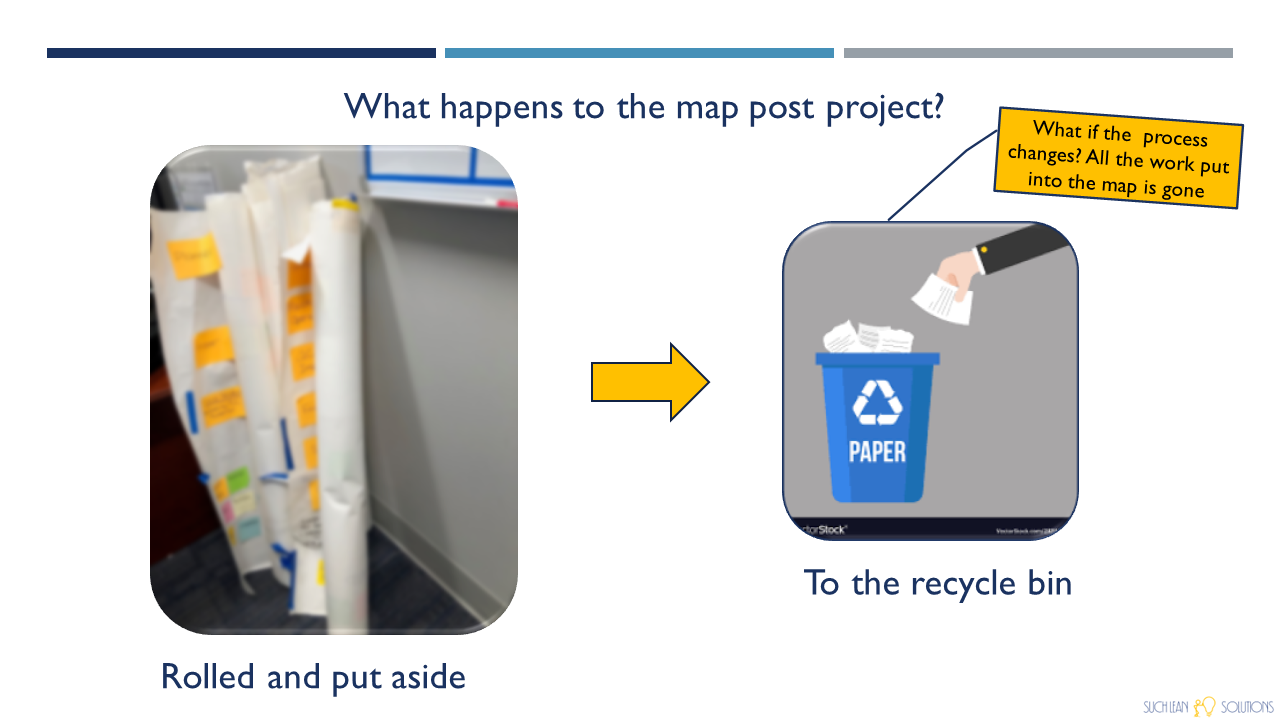
But what happens down the road? The sticky note map provided the information to build and staff our process to the current state. Once we have a plan for production, It gets rolled up and put in the corner. I keep mine for about a year until they eventually get thrown out. Thatís all good until something changes. All the work put into the map is gone. What if my demand or Cycle time changes? Do I have enough staff? Do I have enough equipment? How did the demand
change effect my Takt time? The paper map is gone, the dry erase board is erased and the excel map is difficult to run change scenarios with.
change effect my Takt time? The paper map is gone, the dry erase board is erased and the excel map is difficult to run change scenarios with.
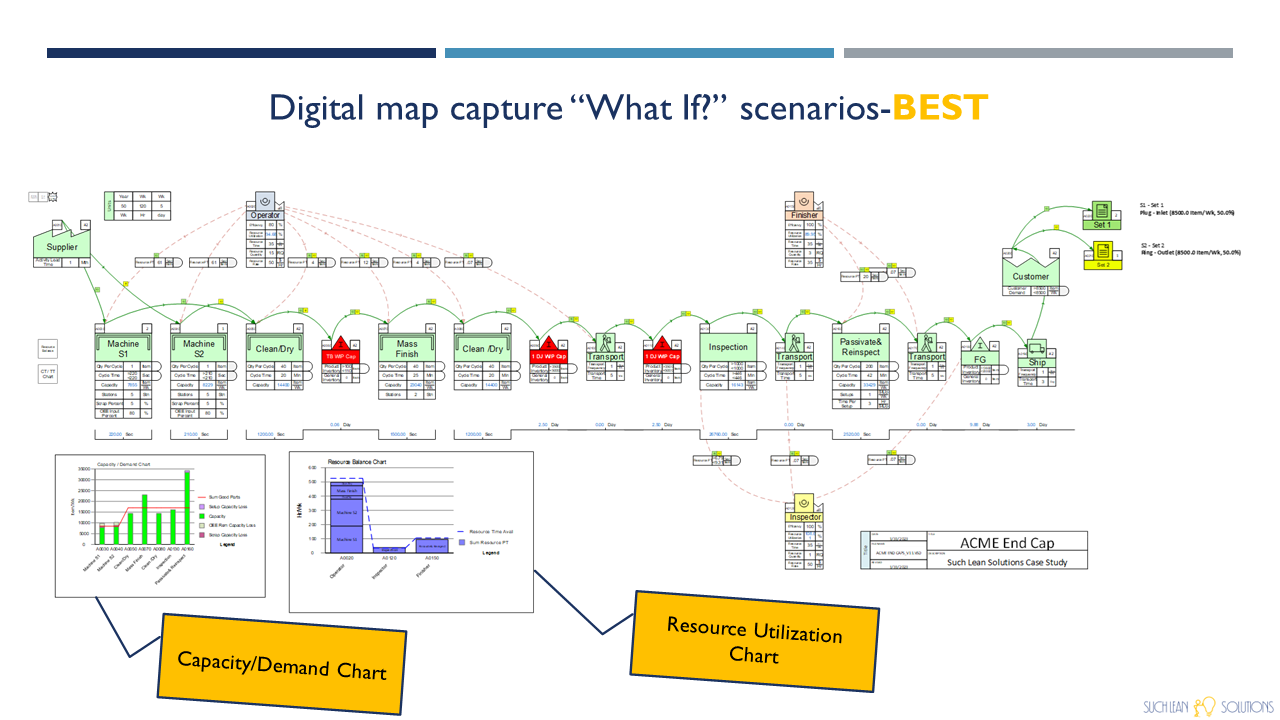
Digitizing the map is Best. eVSM allows the map to be saved electronically and allows for easy ìWhat if ìScenarios. It calculates and displays Capacity/Demand. Cycle time/Takt time, Resource Utilization, Lead times and much more
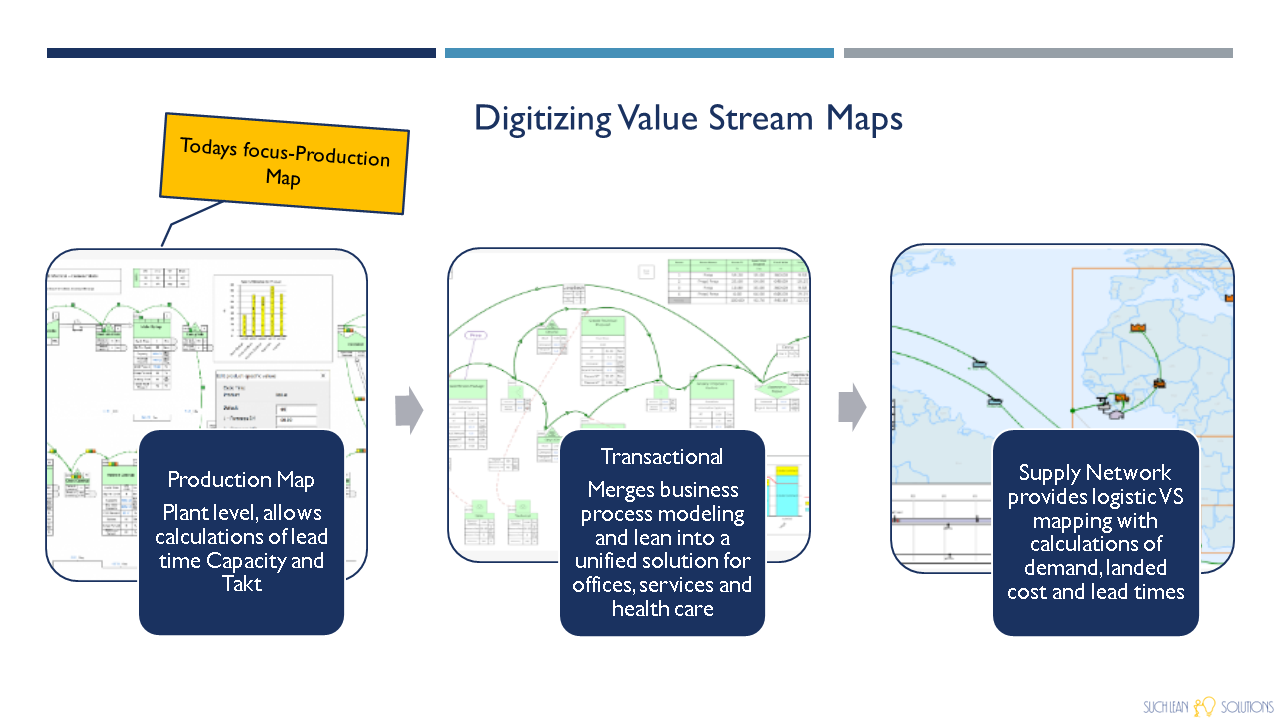
There are 3 types of Value Stream map. Production - plant level value stream. It allows calculation of takt time, lead time, and capacity
Transactional-Merges key concepts from business process modeling and lean into a unified VSM solution for office, services, and healthcare.
Lastly the Supply network map. It provides logistics value stream mapping with calculation of demand, landed cost and lead times.
This presentation will focus on production.
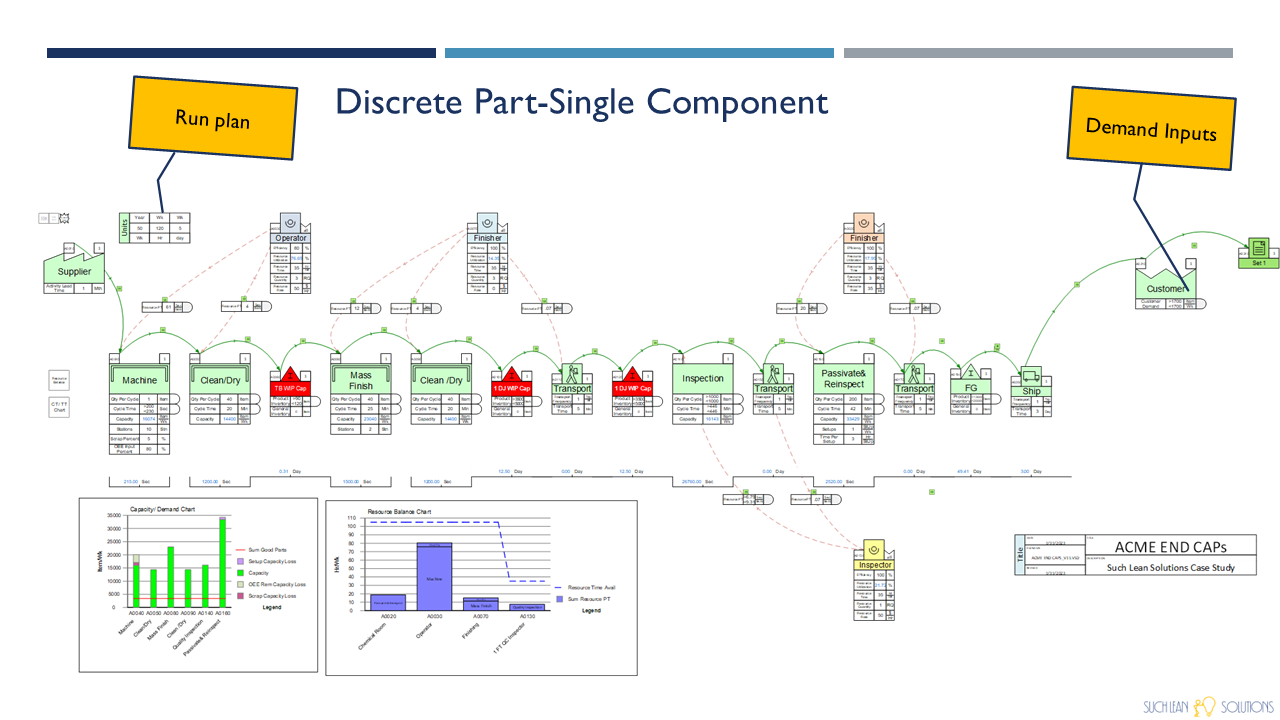
The discrete part/Single component provides a simple map with typical inputs. Itís a living document where you can change variables, click solve and all the process steps are updated. Itís a simple VSM and useful for a dedicated line with one product, but in reality the majority of our manufacturing steps are not dedicated to a single product with dedicated equipment.
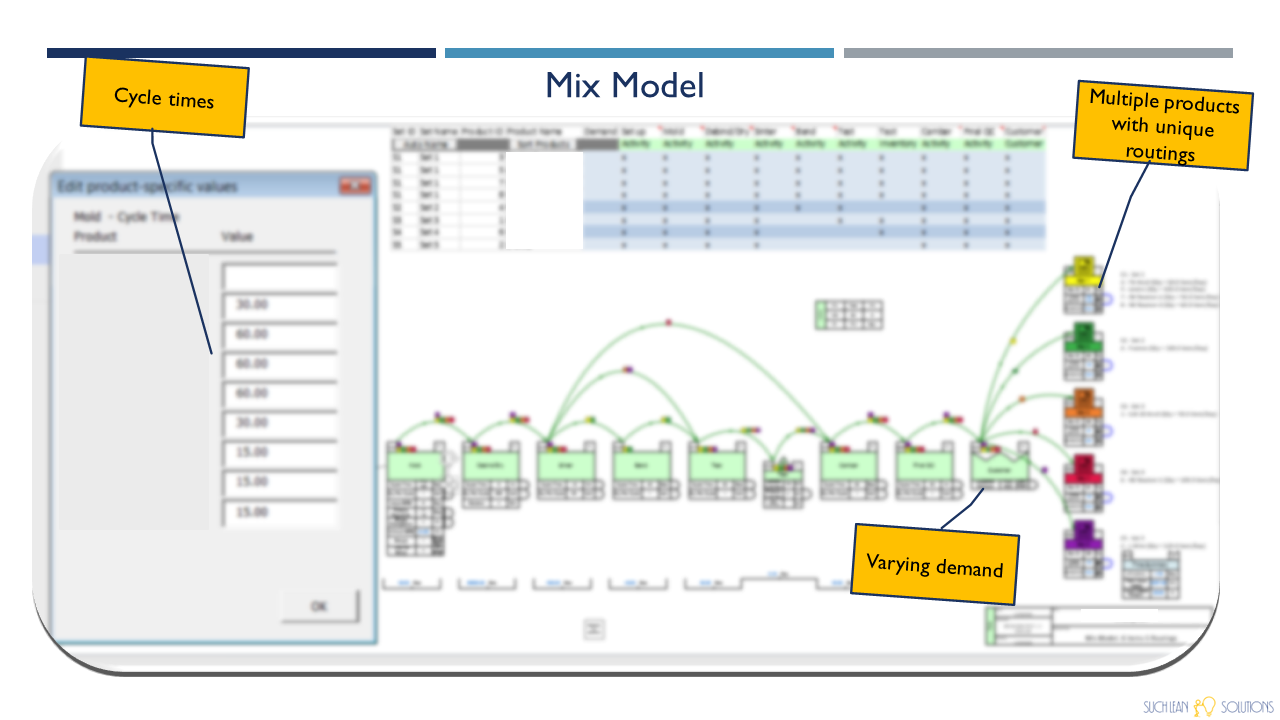
The mix model map allows us to build a product line with multiple products, different routings and cycle time changes. The map allows stations to be shared over multiple products or skipped. Both types of maps are live documents where you can change variables, click solve and all the process steps are updated.
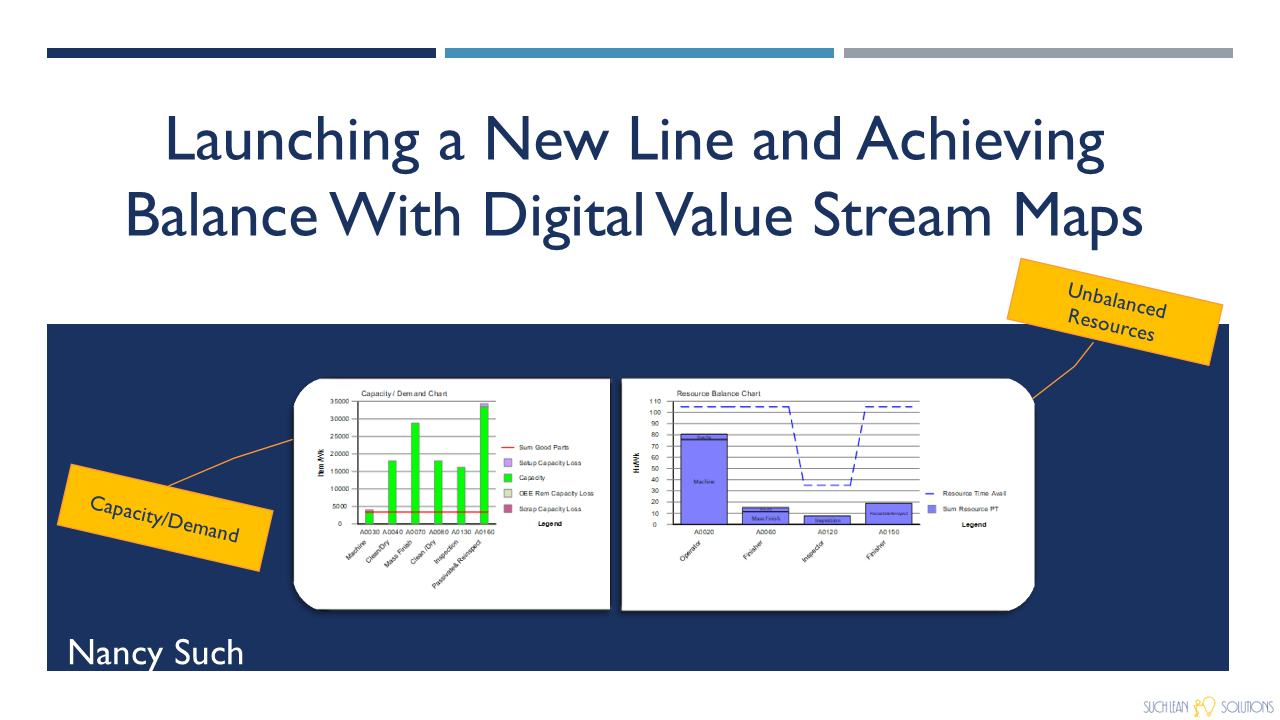
Where is the value in digitizing the Value Stream Map? We will run through a case study where we used the digitized map to balance resources and adjust the product flow.
My case study is in the manufacturing field. At ACME, a new product that had rapidly increasing demand over the needed to be brought in.
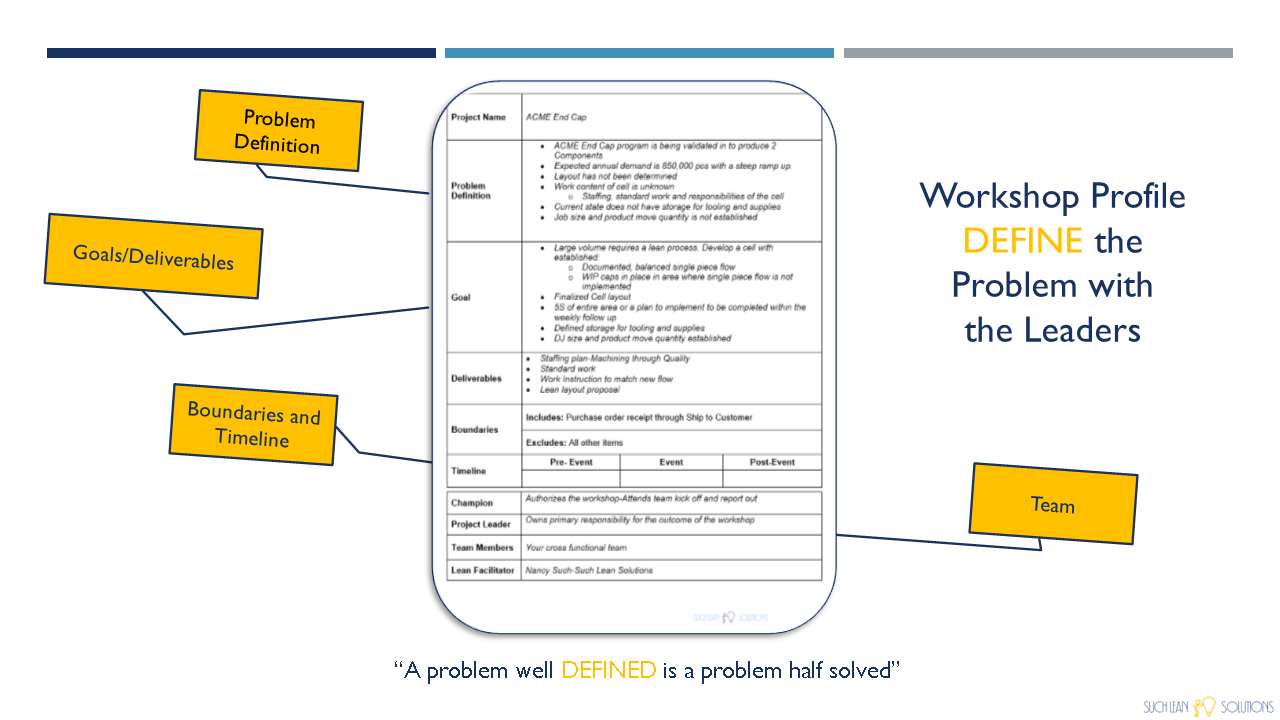
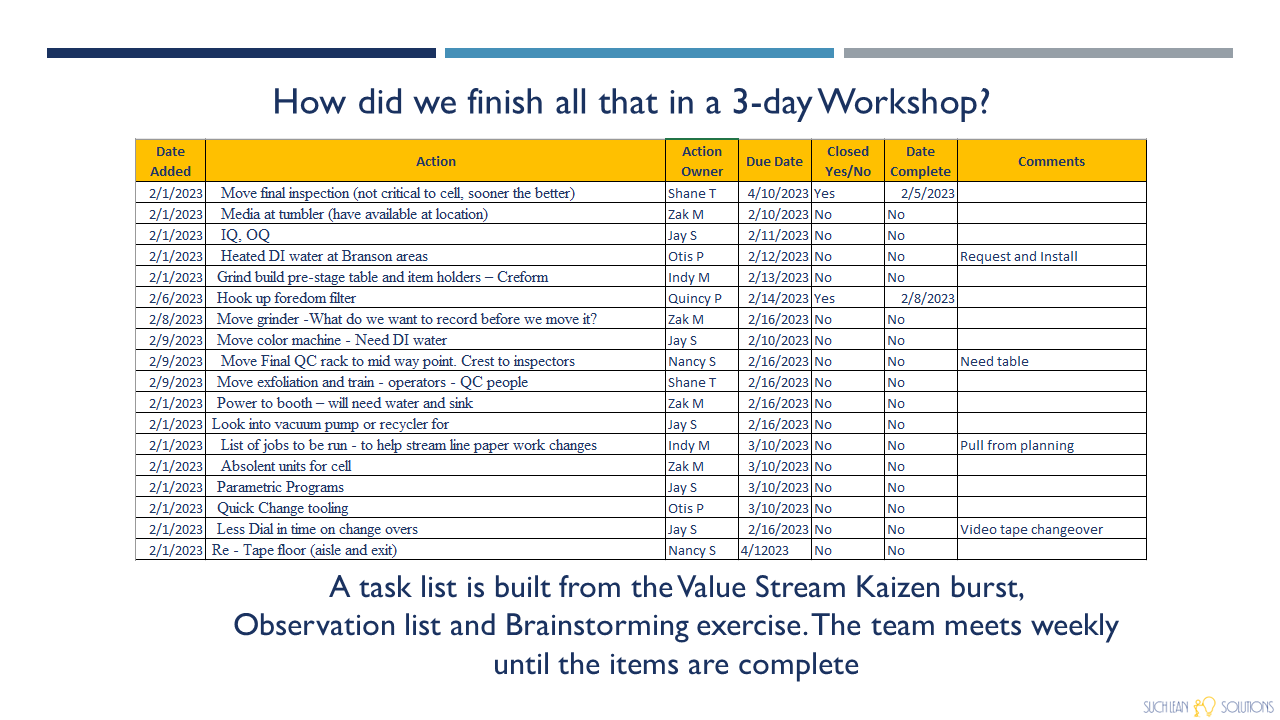
Bringing in a new product line prompted a full workshop with a cross functional team. The first step in the process is to develop a Workshop profile that included The Problem, Goal, Deliverables, Timeline and Team. The Profile is a necessary step to understanding the issues and maintaining focus and a key element in the DMAIC process. ìA problem well DEFINED is a problem half solved.î-Charles Kettering GM.
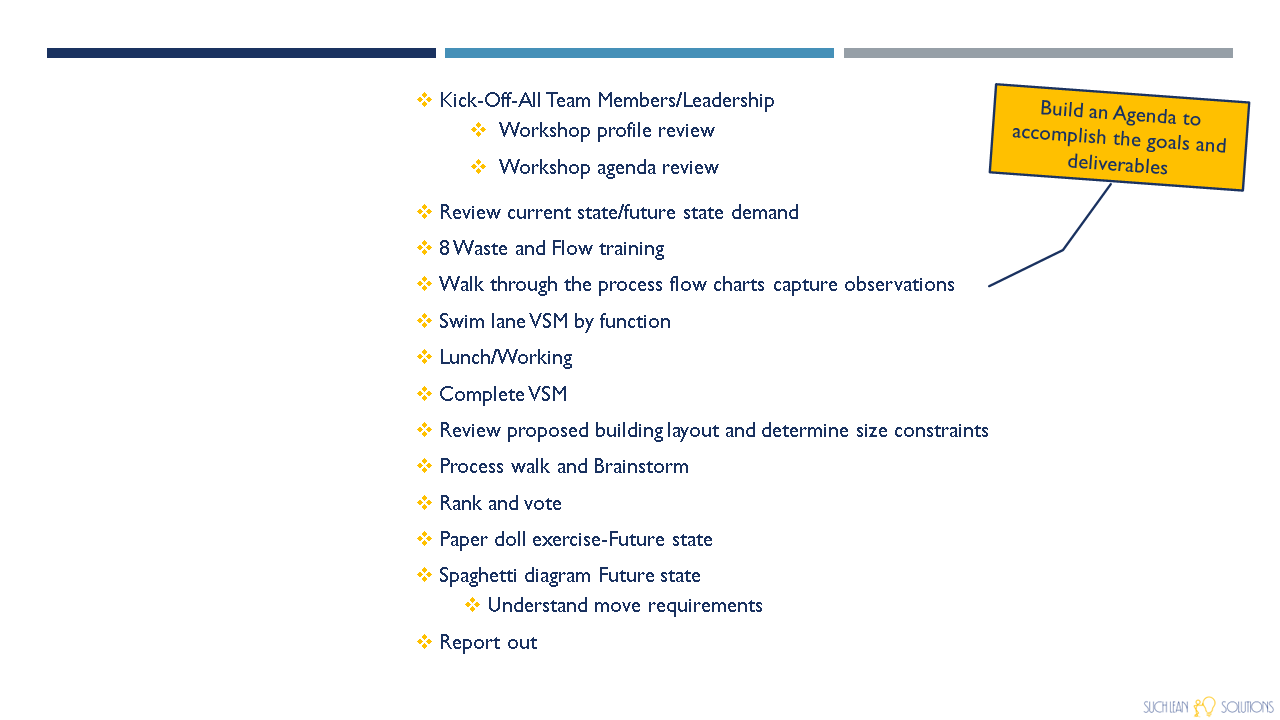
Build an agenda to accomplish the Goals and Deliverables defined in the Profile.
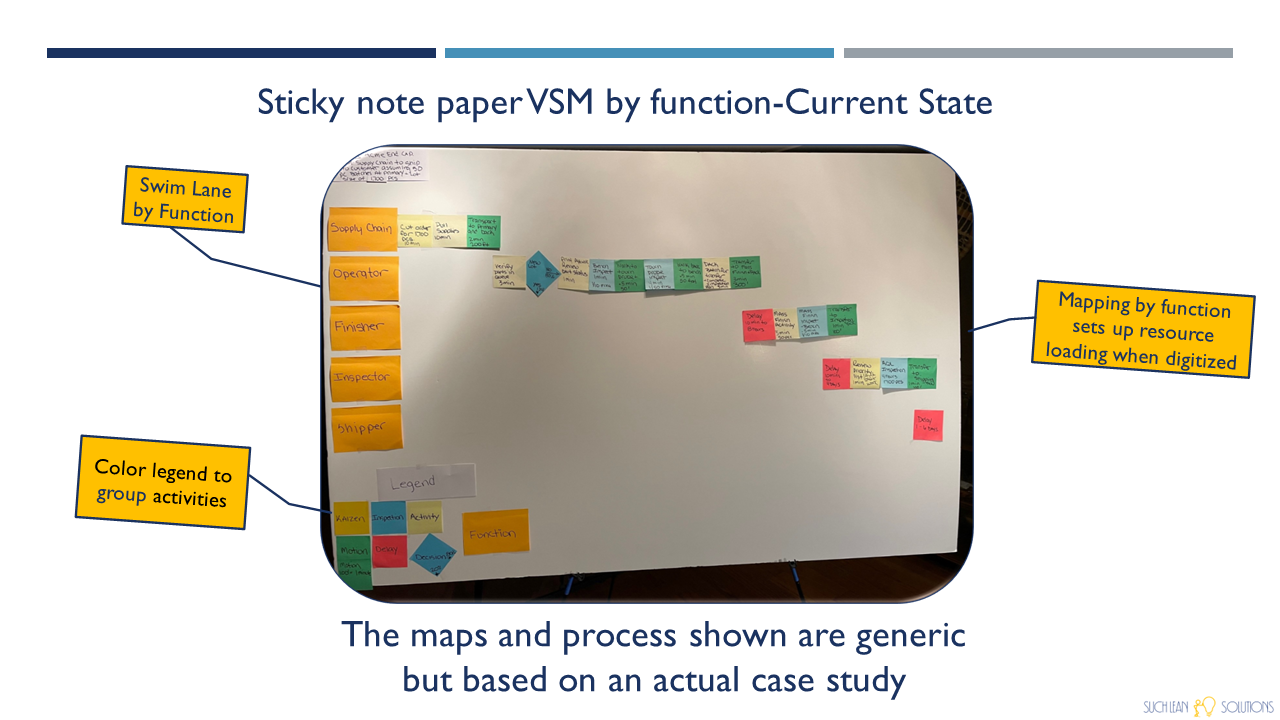
One of the first task in the workshop agenda is the creation of a sticky note VSM by function with your cross functional team. The different colors represent Activity, Motion, Delay, and Kaizen bursts. Mapping by function allows us to run resource utilization analysis down the road. The map is a key element in MEASURE phase.
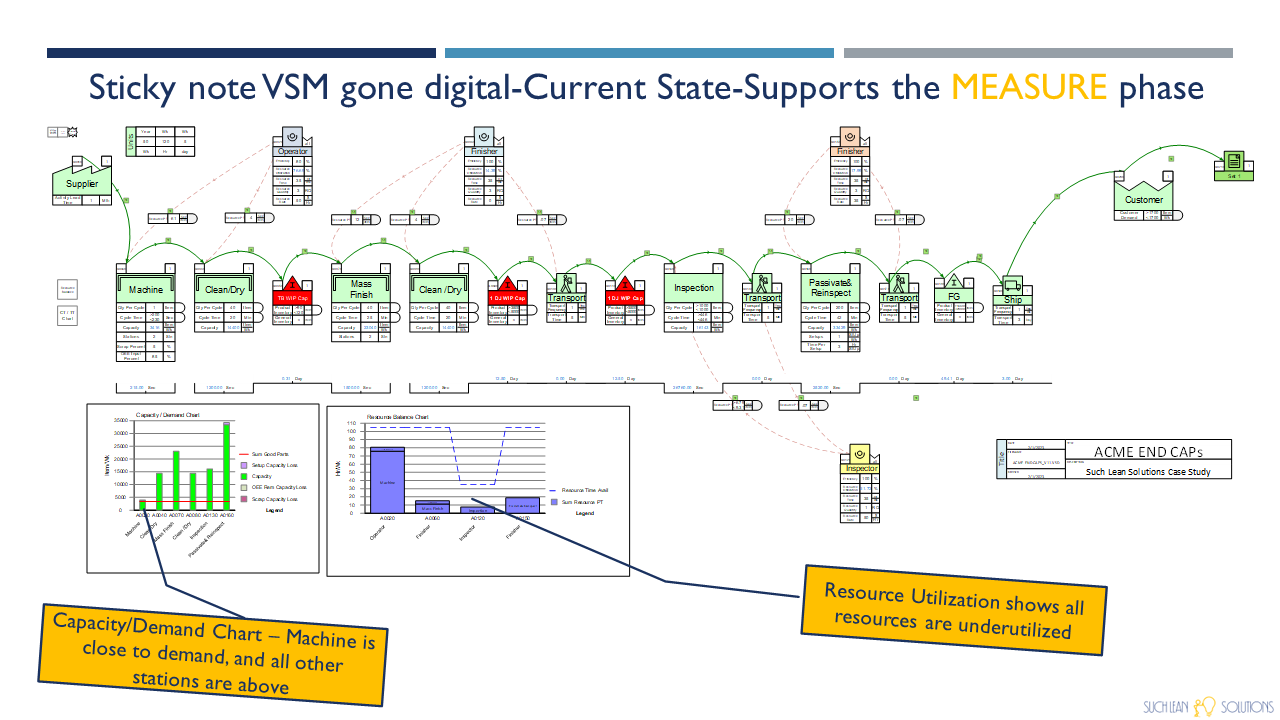
Once the team completed the paper map I was able to digitize it with eVSM and simplify the number crunching process. More MEASURE phase.
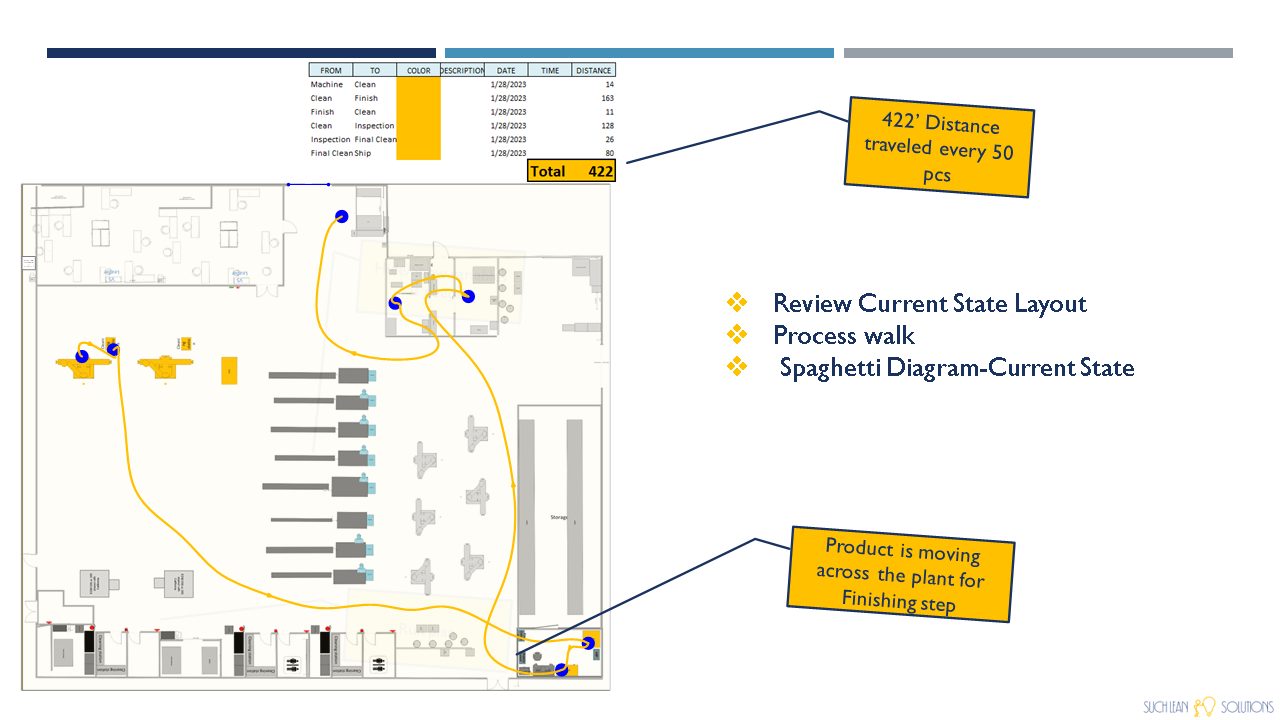
We then reviewed the Current layout, went for a group process walk to capture more observations. From there we spaghetti diagramed the Current State and found that we traveled 422í for every 50 pcs manufactured. This involved both MEASURE and the start of the ANALYZE phase.
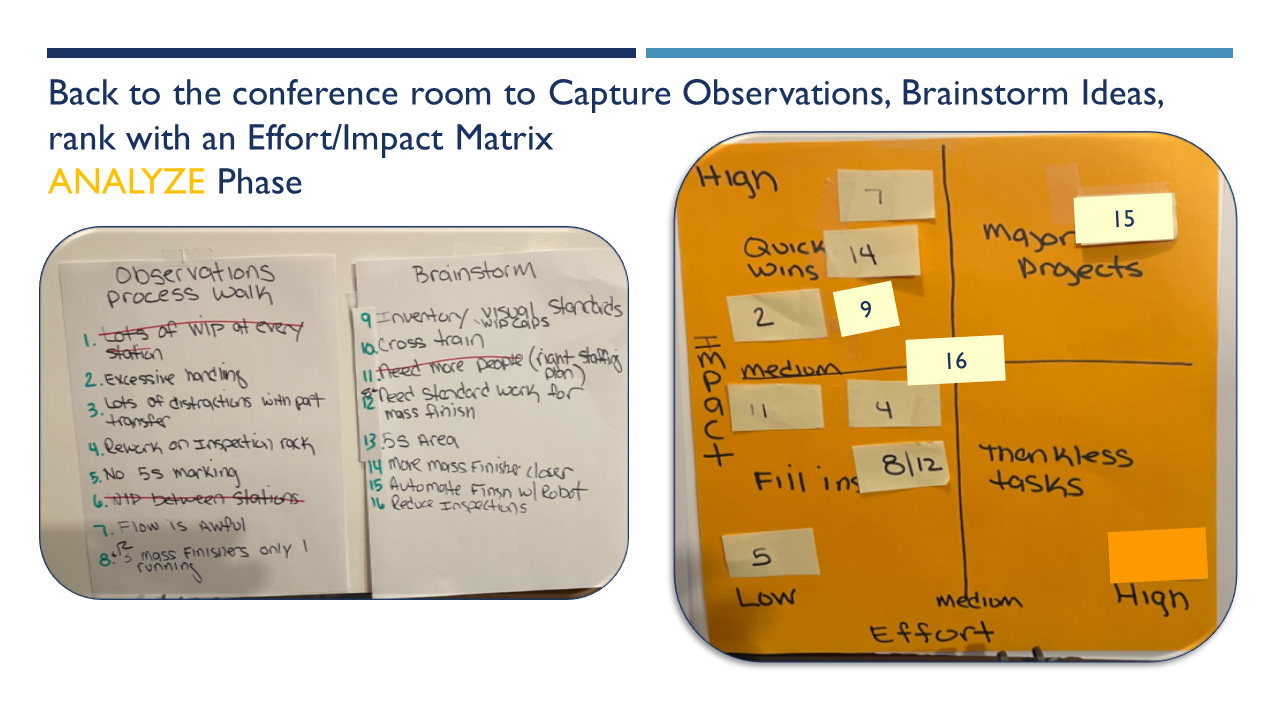
We then went back to the conference room to Capture Observations, Brainstorm Ideas and rank with an Effort/Impact
matrix with a weighted vote to prioritize.
matrix with a weighted vote to prioritize.
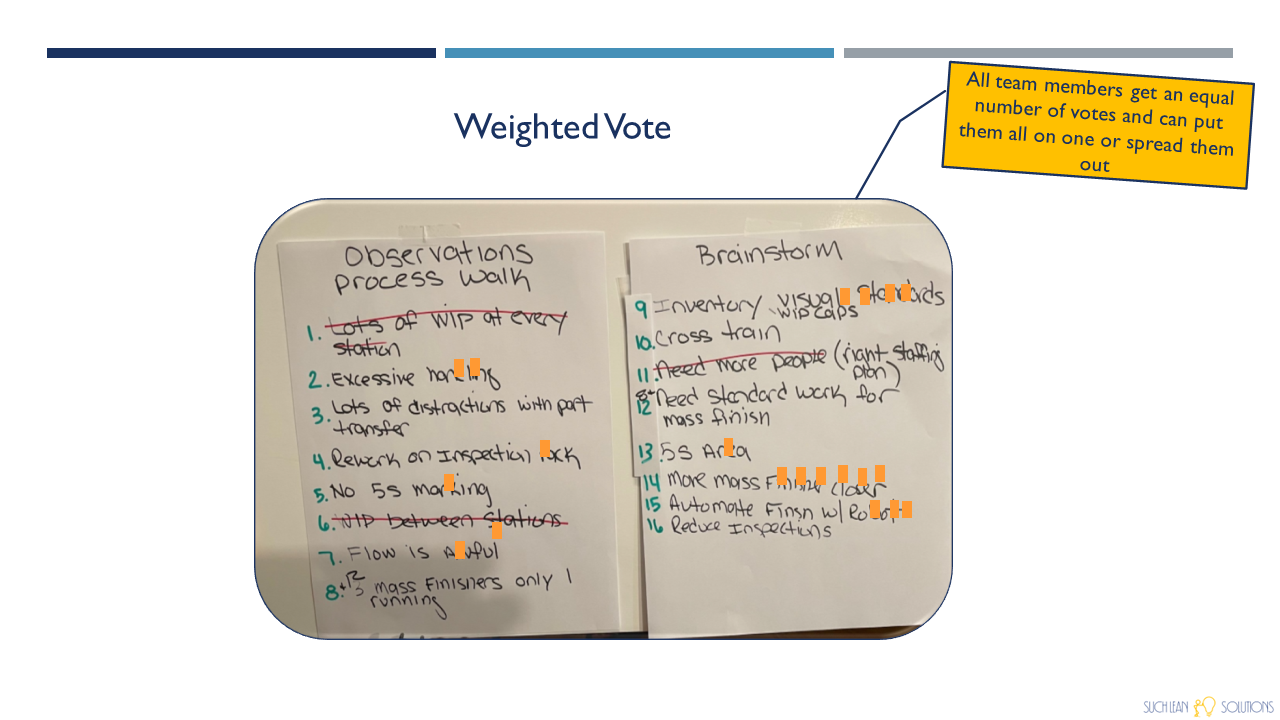
All team members get an equal amount of votes and can put them all on one or spread them out
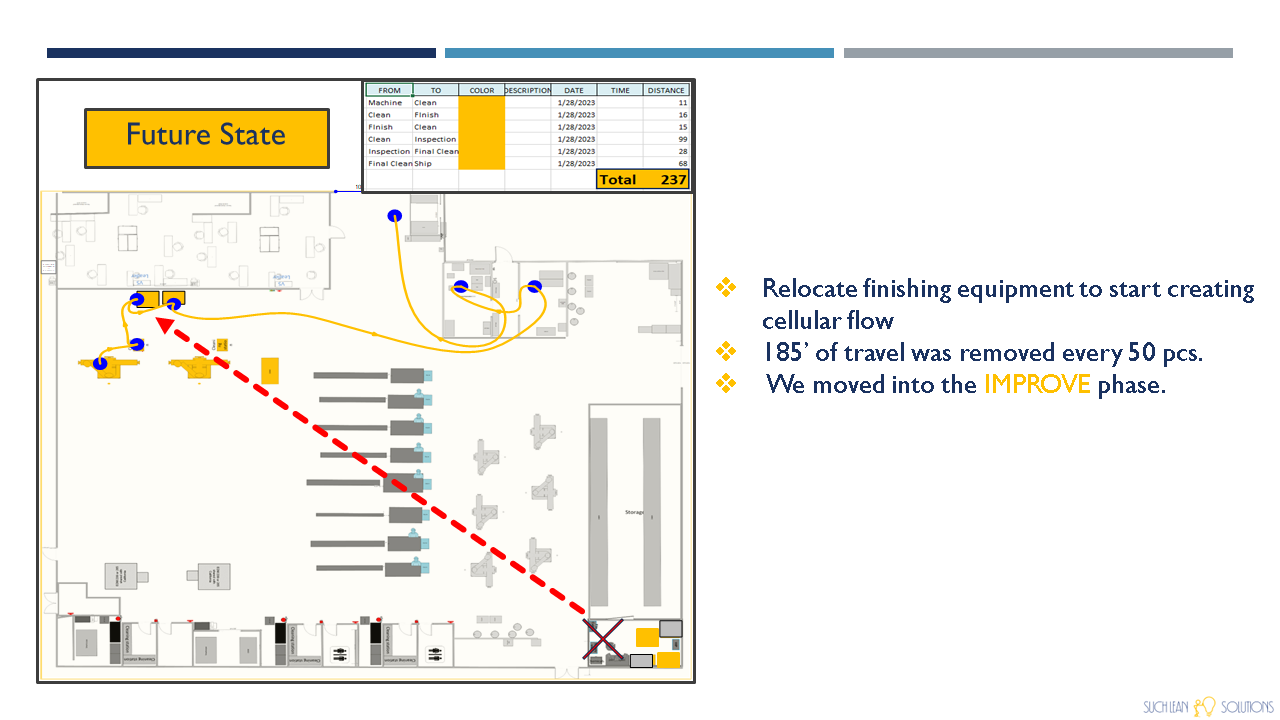
By locating finishing equipment within the cell instead of across the plant we could save 185í of travel every 50 pcs. We moved into the IMPROVE phase.
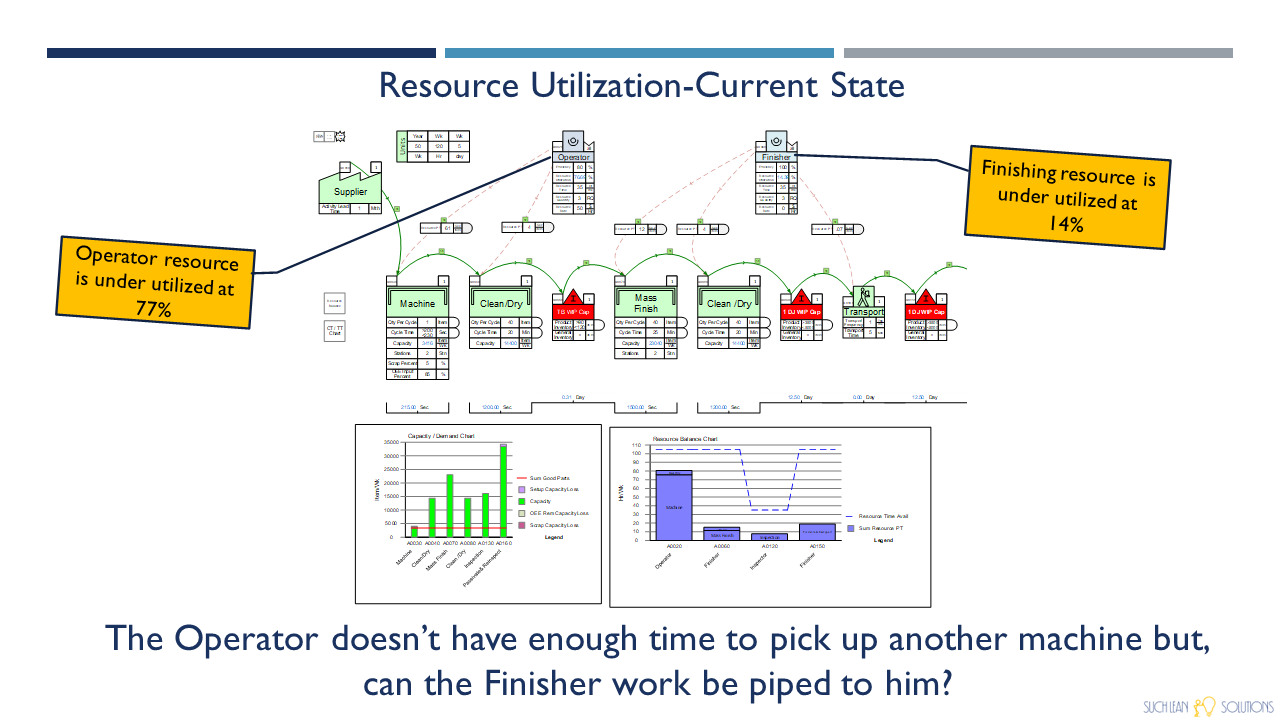
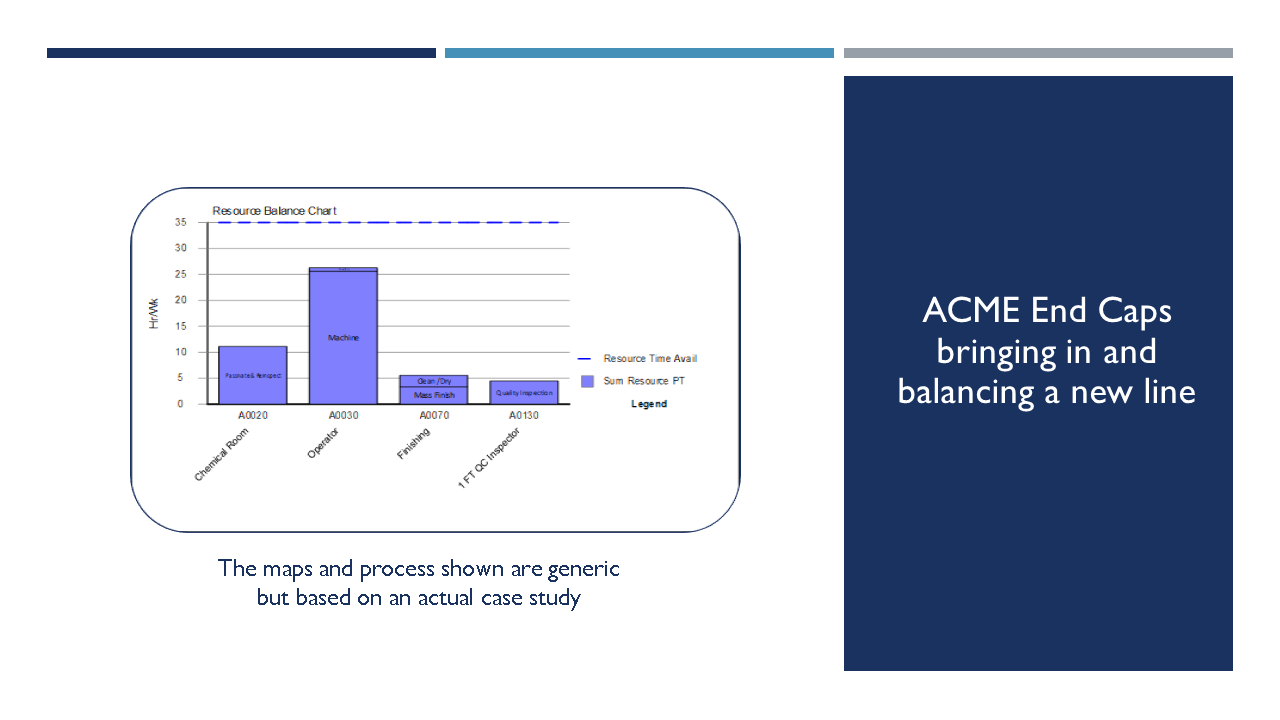
With the Machine Operator at 77% utilization and the Finishing resource at 14% utilization, it looked like the Operator has enough time to pick up the Finishers responsibility once the finishing equipment was moved into the cell. From here we piped the extra labor to the operator, placed the finishing equipment in the new cell and reran both maps-More ANALYZE phase.
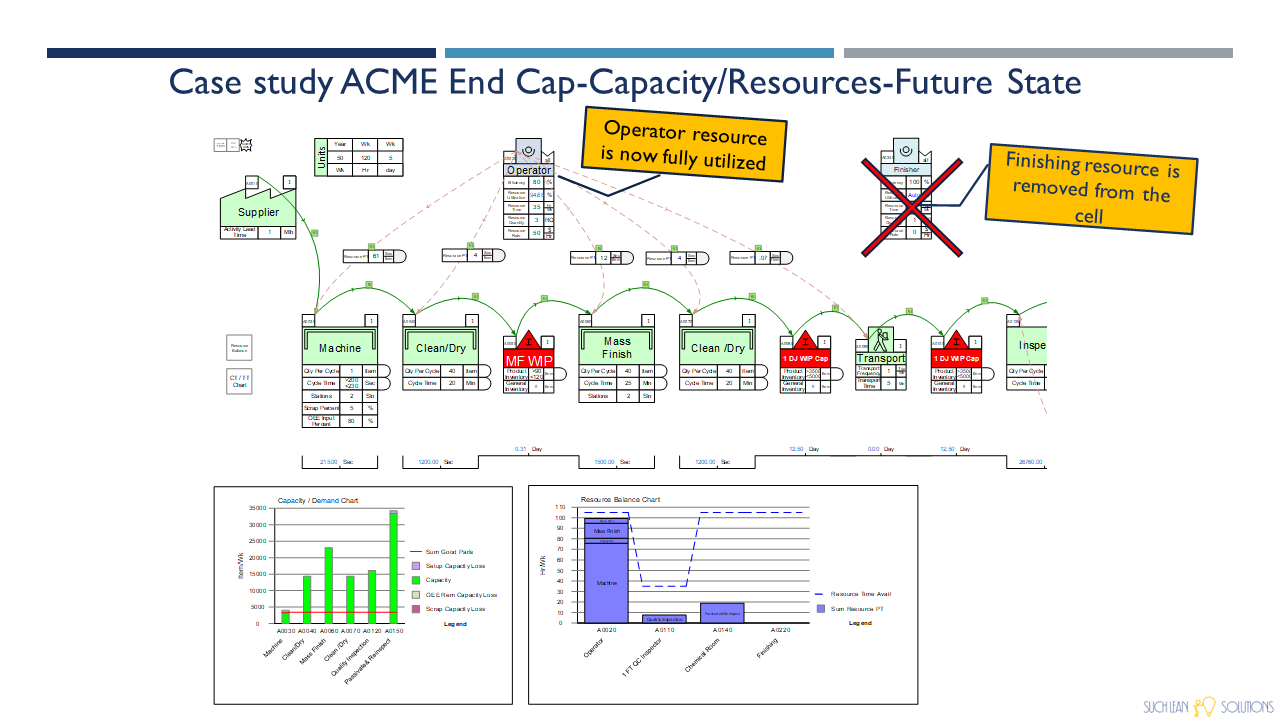
So thatís what we did. We moved the equipment and piped the finishing labor to the operator. The Operator is now fully utilized and the Finisher is removed from the cell. This was all free time to be filled but remember that it was not enough time pick up another machine so our operator was left to text his friends or read the paper in his free time. You might ask, can we really bring an operator up to 94% utilization? In this case we can. The Operator efficiency was already set at 80% allowing for human behavior. People can't work like machines and that needs to be accounted for. Now that we had the framework we could start to IMPROVE and build the plan to meet our future state.
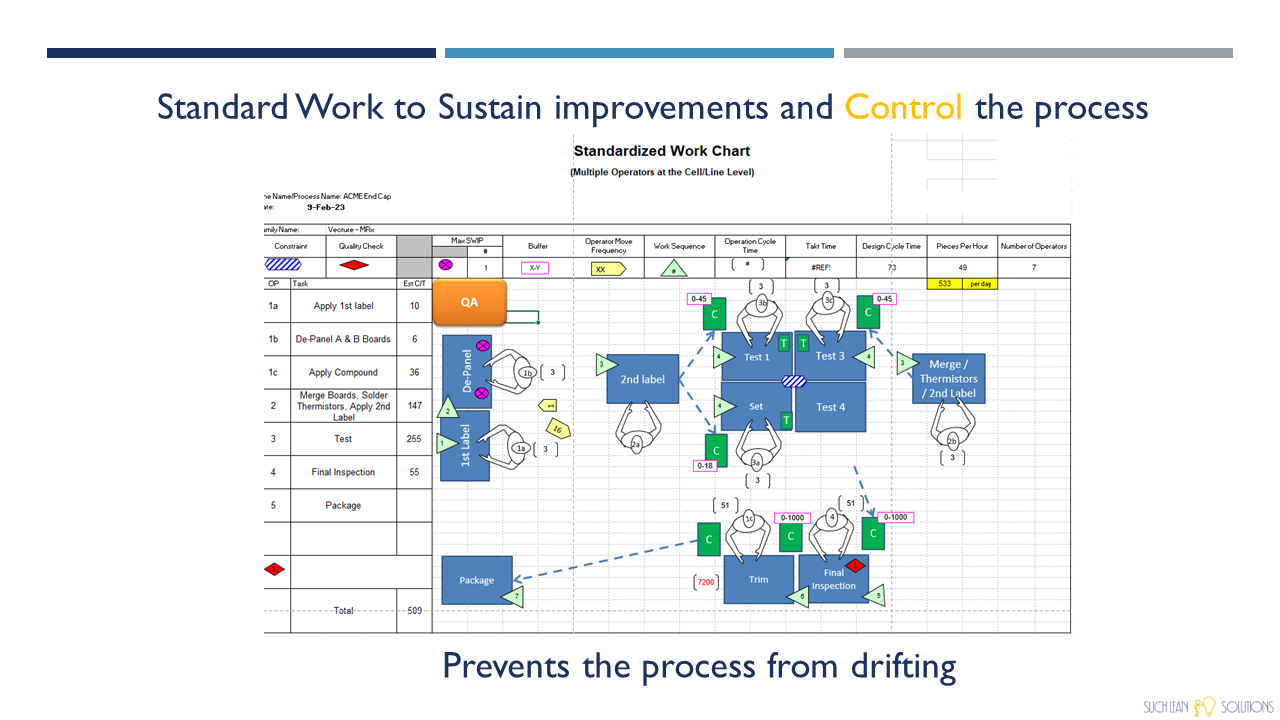
Standard work is built with the team. Its how the agreed upon process is run and helps keep the process from drifting.
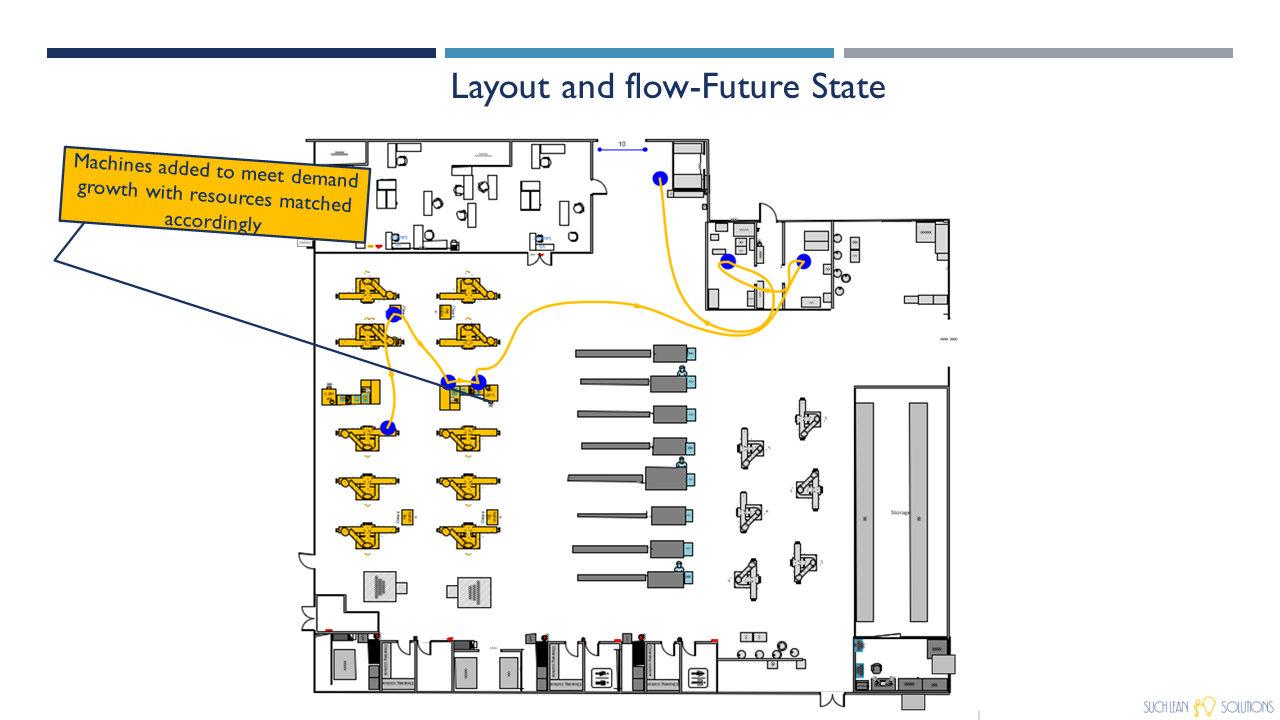
In the Future State layout that was designed to meet the steep demand increase, there are 10 machines flowing to a central finishing area staffed by the machine operator.
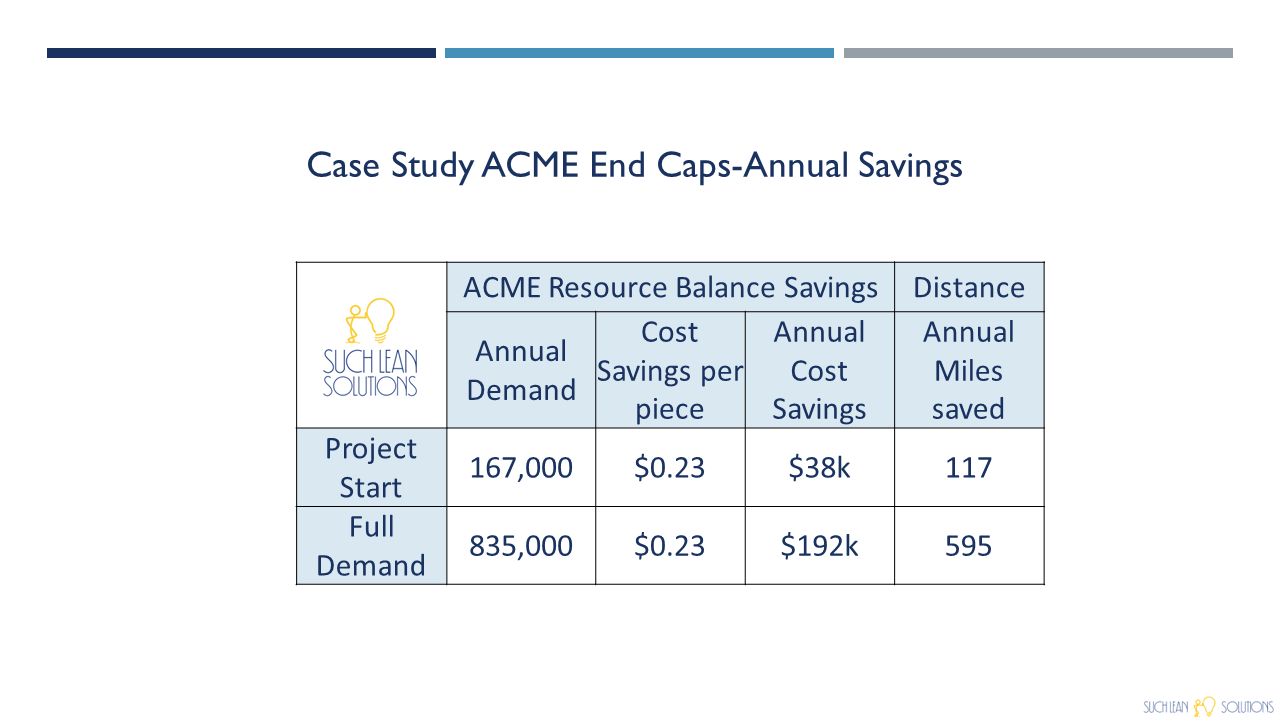
When the change was implemented there was 1 Machine producing product. Today there are 10 and the savings continue. What seemed like a small change in the process turned into big dollars savings
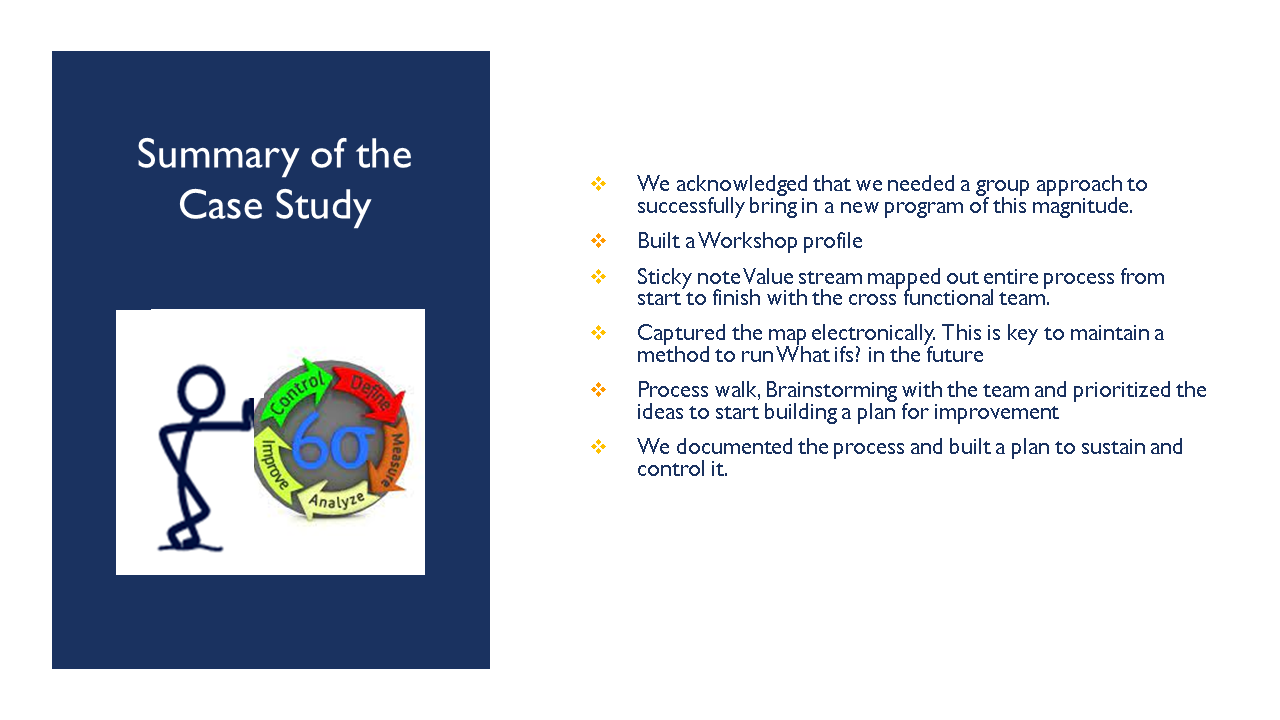
What did we do here? The Leadership team acknowledged that we needed a group approach to successfully bring in the new program.
We built a Workshop profile with the Leadership team that captured the Problem, Goal, Deliverables and identified the cross functional team.
Next was a Sticky note Value stream map that captured the entire process from start to finish with the team. Its critical to capture by function to be able to balance resource in the digitized map. This is not an easy task to execute properly and can get tricky. I then captured the map electronically, this is key to maintain a method to run "What ifs"?. in the future. The team was then lead through a process walk to capture current state observations and begin our improvement process. You don't need to be a Lean Six Sigma Blackbelt to follow the DMAIC process but it certainly helps.
Some of the services that suchlean consulting provides:
- Leading Value Stream Mapping events in order to improve performance or bring new product lines in with a complete plan for production.
- Site implementation of hourly, daily, weekly metrics, ensuring that collection and monitoring of this information is meaningful in the identification of areas requiring process improvement.
- Drive the development of product flow and make recommendations on the efficient lay-out of the plant floor.
- Calculating complex capacity analysis, line balance and labor utilization in a mix model environment.
- Digitizing Value Stream Maps
- Lean training

Here is Nancy's contact info if you would like request additional info or services from her