Most production lines make product variants with different demands, cycle times and routings through shared equipment and staff resources. Being able to handle multiple products with these differences on a SINGLE map (mixed model mapping) simplifies understanding of the value stream, calculating lean metrics, seeing the waste and making decisions on what to improve next.

To illustrate, we have applied the eVSM Mix software to create the digital VSM corresponding to the case study from Kevin Duggan’s "Creating Mixed Model Value Streams" book, second edition. This book is a great resource for Lean/Mixed Model Production that many of you may have come across. We recommend it.
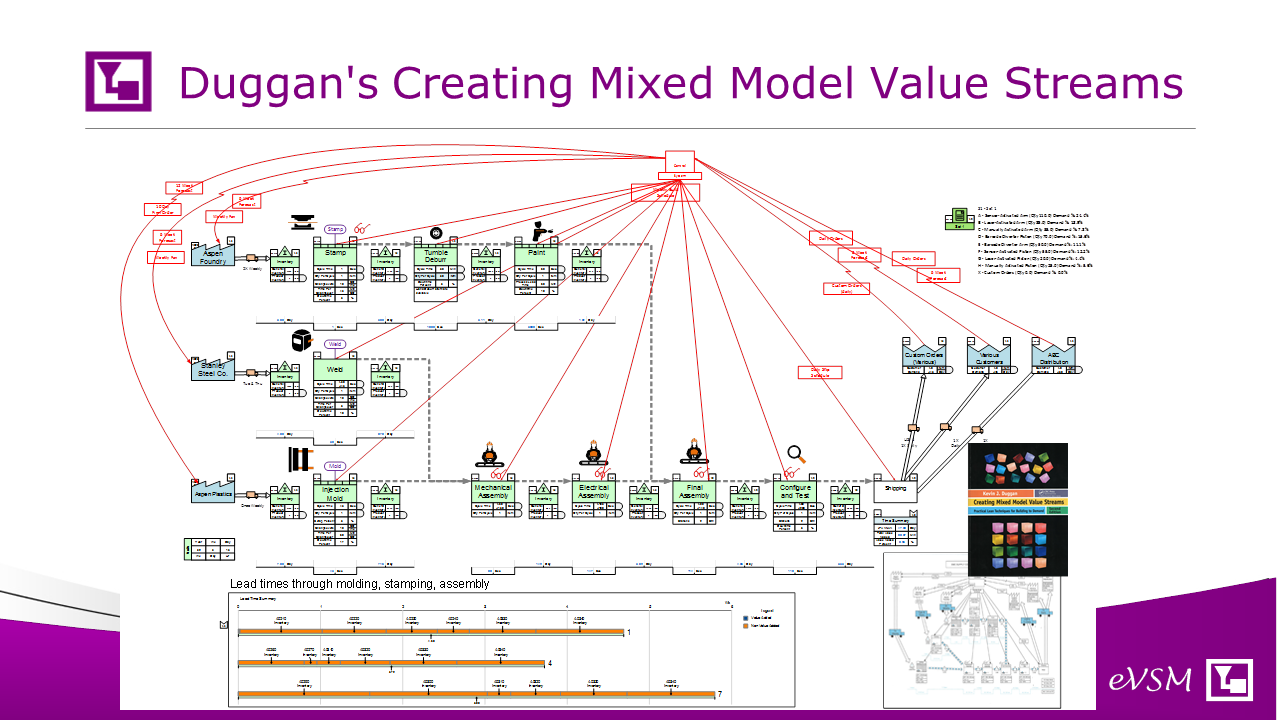
On the bottom right you see the current state map for one of EMC's value streams (The case study in the book). This value stream produces 9 products through shared resources
The map shown is the eVSM depiction of that current state map and has automatic calculation of lean metrics like capacity and lead time. The results correspond well to those detailed in the book
Some interesting points to note:
1. The little tabs to the right of some of the data blocks like "cycle time" and "customer demand" allow the user to put in product specific values to match the data in the case study
2. The variable names and equations are all pre-defined and are associated with the green VSM shapes. They come out with the green shape using "drag and drop". So the map is built using a standard that incorporates shapes, variables, equations and charts.
3. The products in the case study use the same routing. That is they all go through the same green shapes in the same sequence. In general this is not true for product variants and eVSM allows differences in routing between variants.
4. We actually took a picture of the map in the book and sketched over it much like we typically do with wall maps. It was a quick process.
Watch a quick video this in action at https://www.youtube.com/watch?v=1qTSiUj8sWU
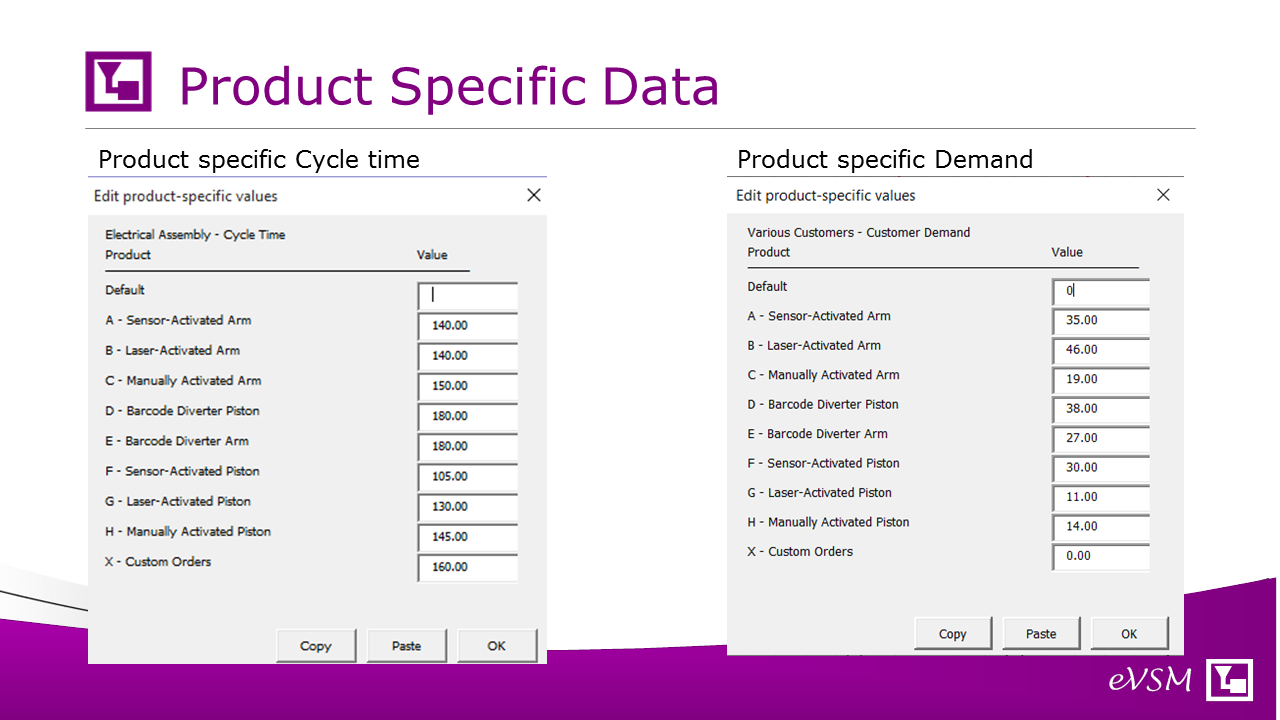
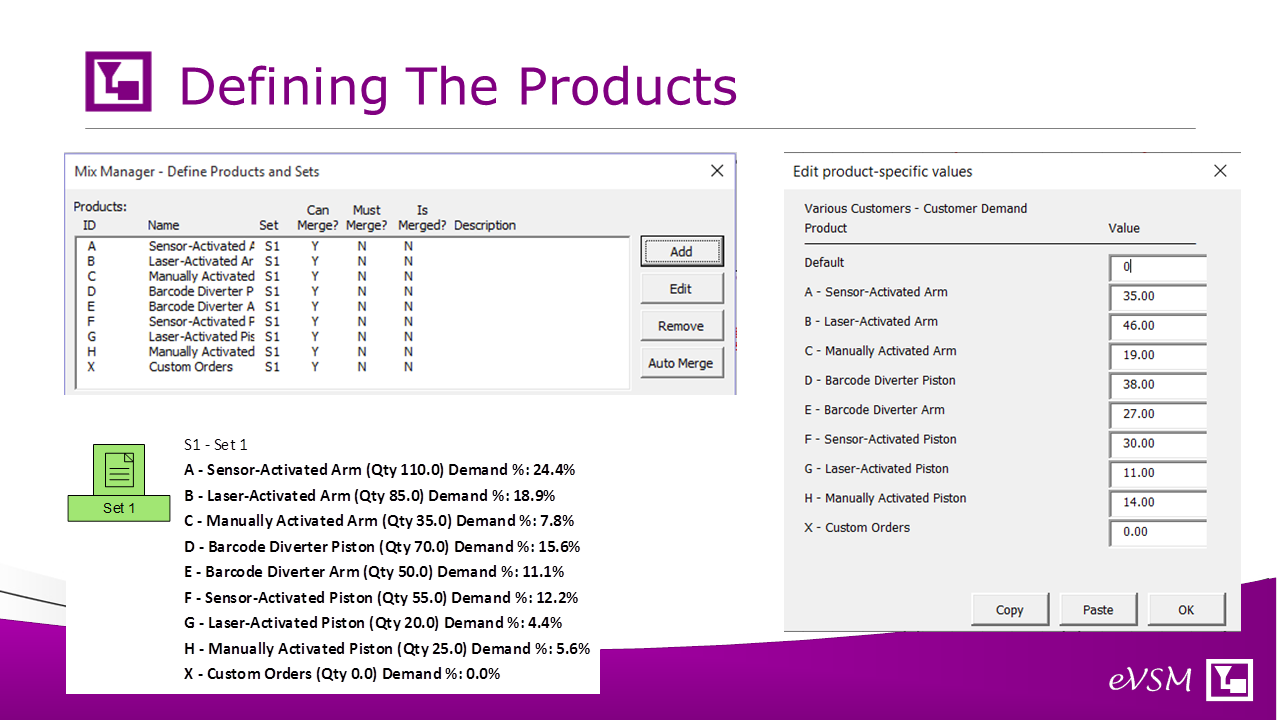
Dialogs like the one above allow the lean practitioner to add-in product specific values for items like customer demand or cycle time.
For convenience, data can all be input via Excel
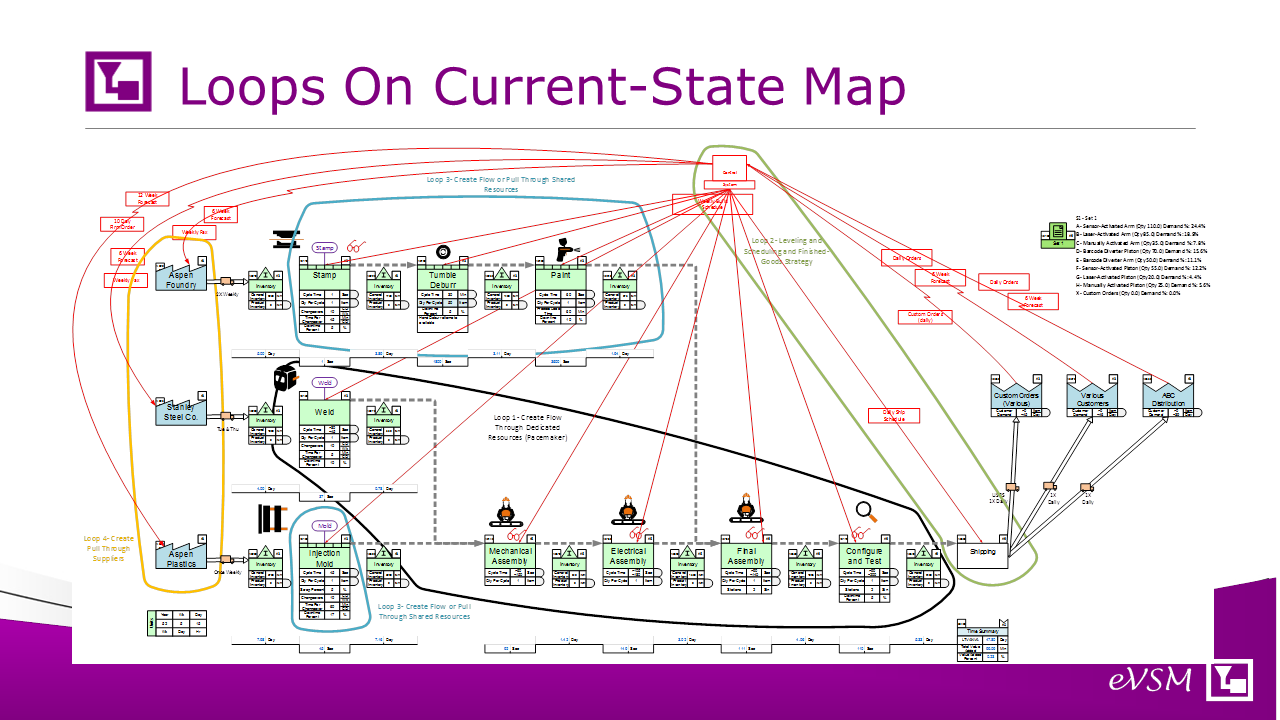
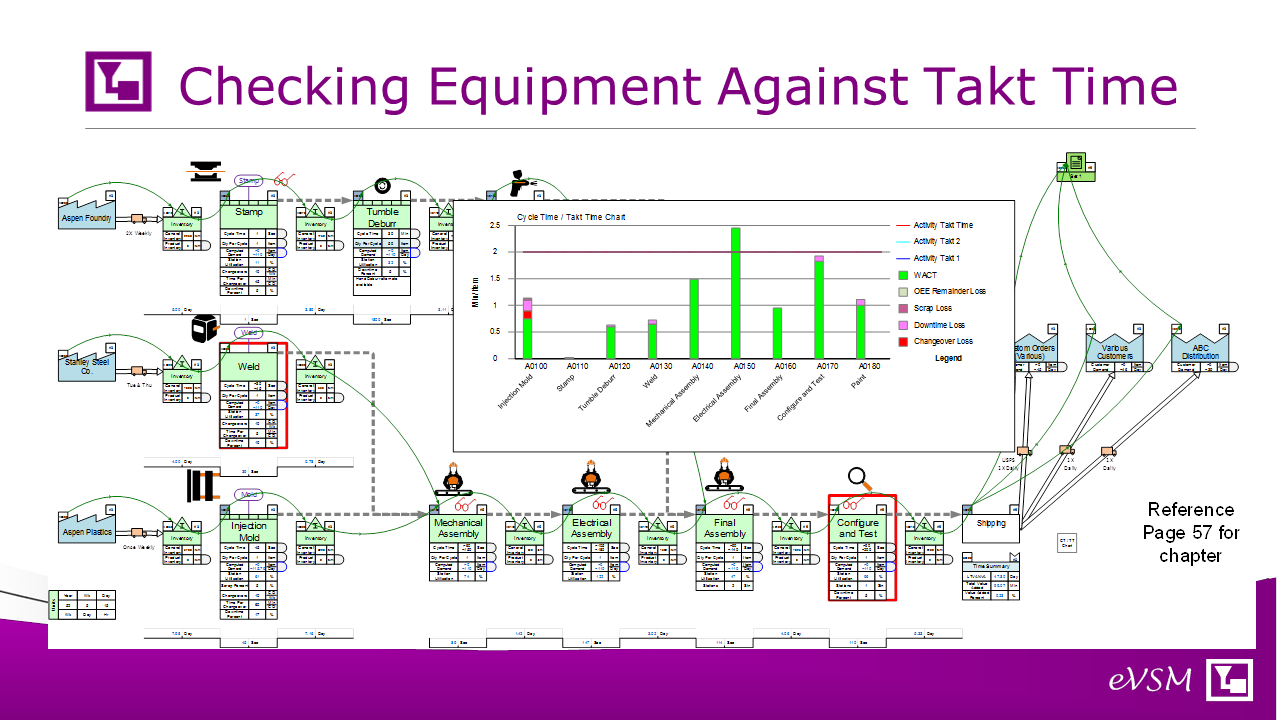
The automated Cycle time/Takt time chart (center of the map) allows us to check equipment capacity against the demand. The automated calculations match well with those done by Duggan in the book
The case study uses this data to help design a pacemaker cell. See Chapter 3 for more detail.
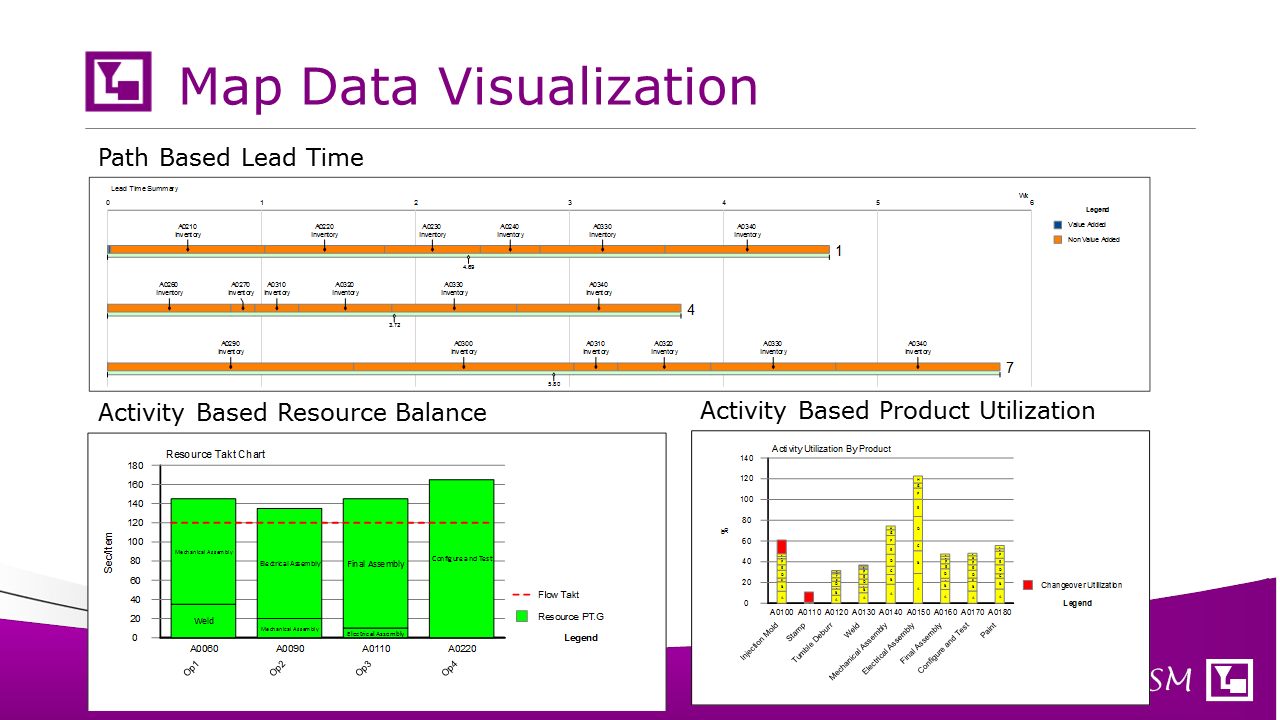
eVSM also has a staffing resource model where you can allocate time from one or more resource pools to production activities. It will then plot a resource balance chart
The eVSM maps ability to do quick 'what-if's' are very useful for value stream design functions like line leveling
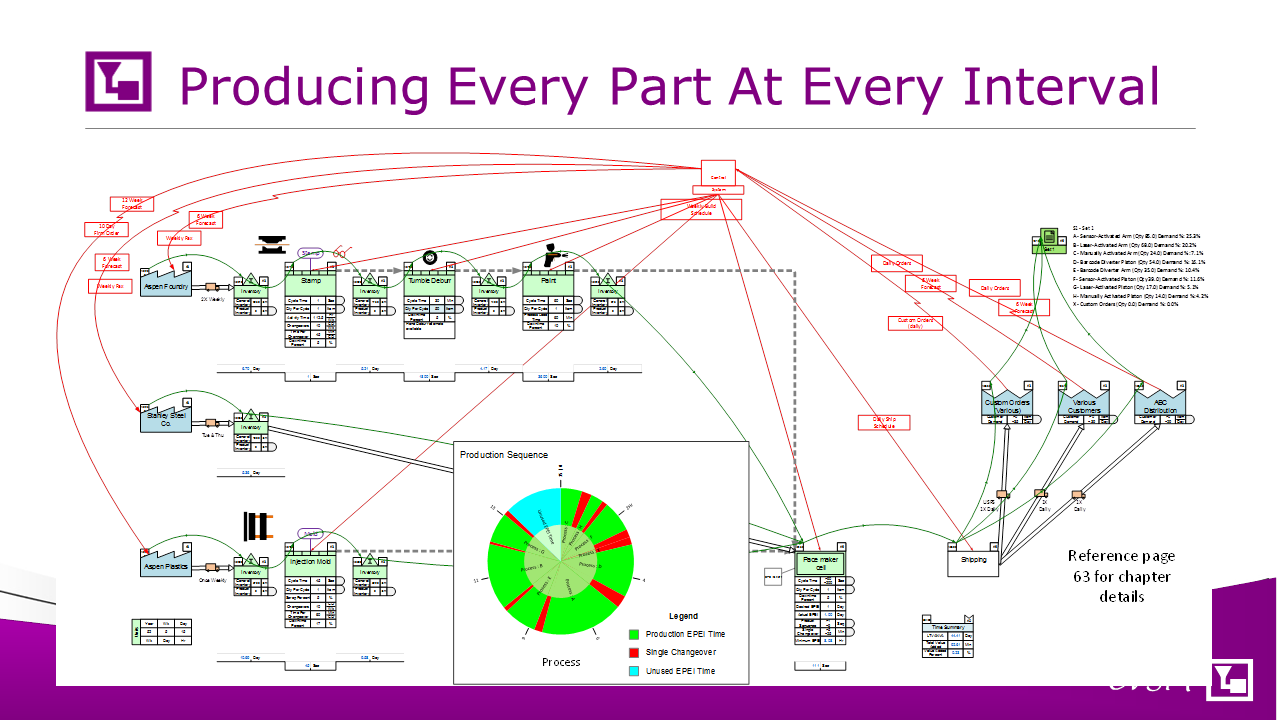
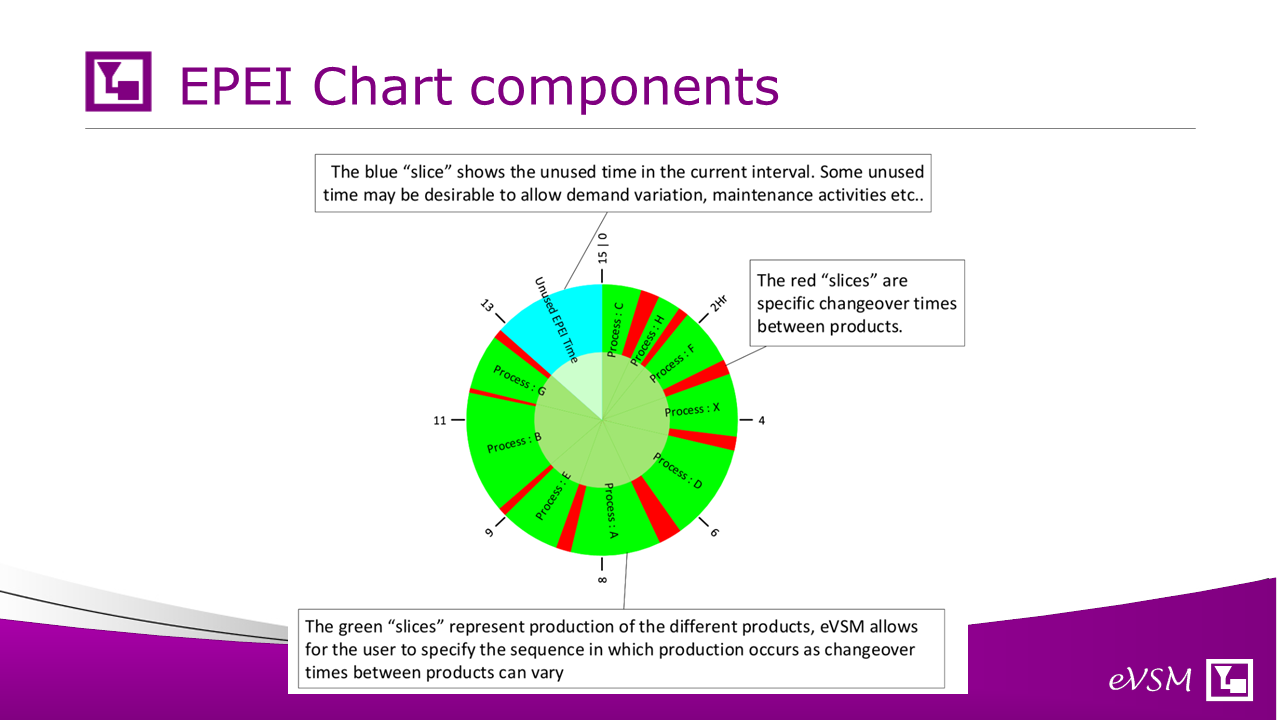
eVSM Mix allows EPEI metrics to be added directly to the map to specify product sequence and related CO times. The lean practitioner can play with different interval times and do 'what-ifs' based on impact of reducing changeover times through SMED activities
We built upon the excellent methodology and case study in Duggan's book to show how eVSM Mix can be a very effective digital component that simplifies the mapping, standardizes it for usage throughout the company and automates the calculations and charting
Just contact us at support@evsm.com to discuss how eVSM Mix could benefit your operational excellence team. Digital Mix Model VSM can provide a step change in your OpEx efforts.