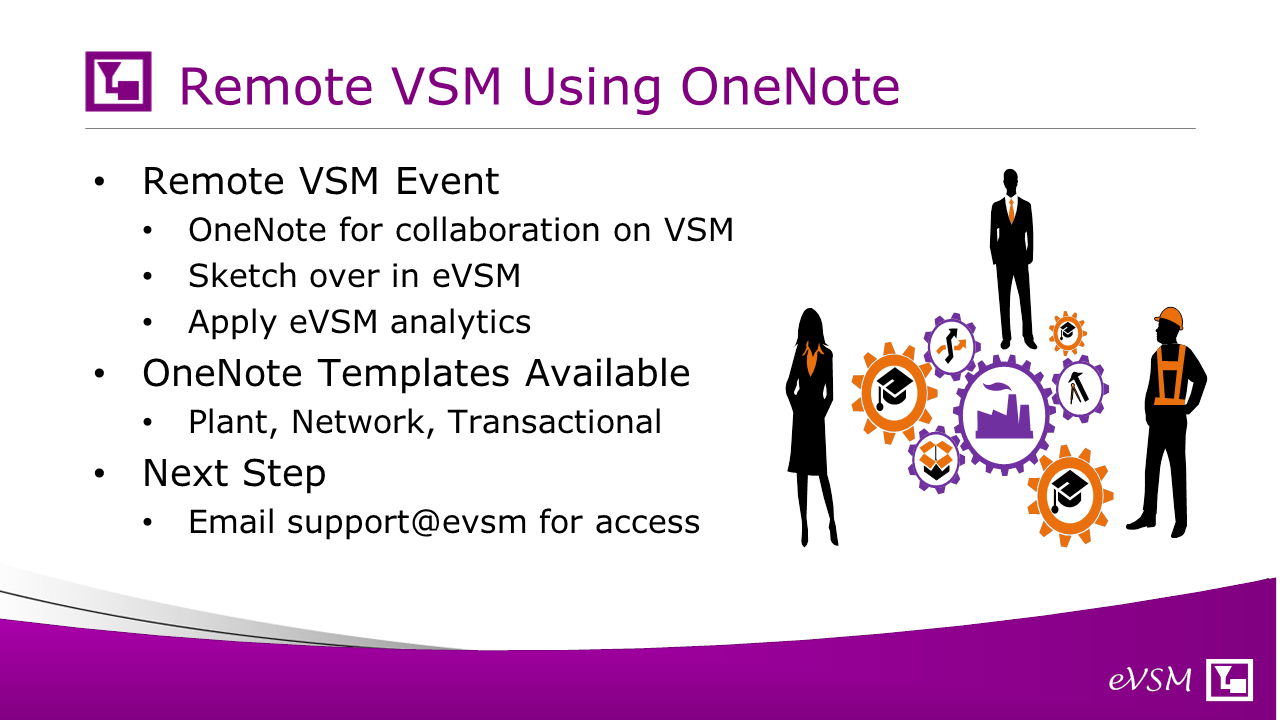
The ability to hold VSM events remotely, (where it's not possible to co-locate the team physically) has become increasingly important. Our group has created a solution for VSM capture and analytics in this remote environment, leveraging Microsoft Teams and the Microsoft OneNote collaborative application. For companies that have standardized on Google-based collaboration, a Google drawing-based tool for remote VSM has been developed also. In this blog, we will focus on OneNote.
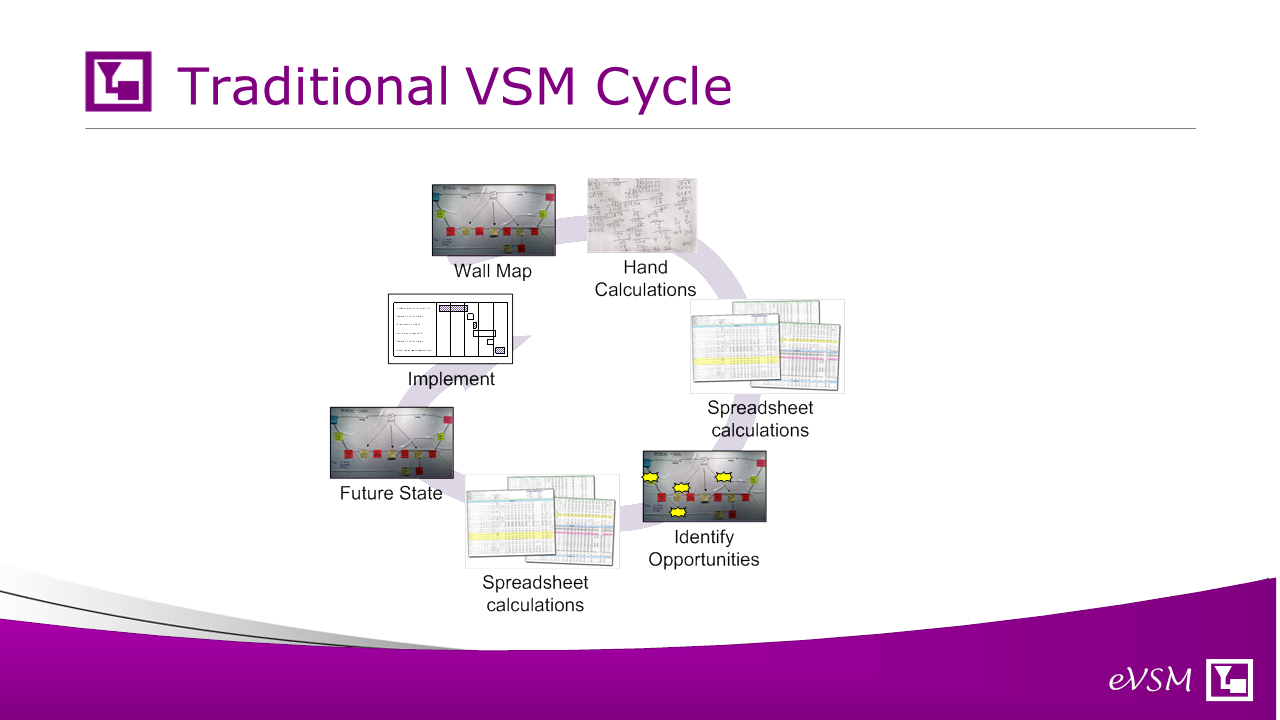
Let's start with looking at the traditional VSM event and improvement cycle, something we have seen in many companies. It's a physical event that starts with a wall mapping activity, with people gathered in a room. A value stream charter is created in advance, so the goals as well as the start and end points of the map are clear for everyone.
The team walks the value stream, if possible, collecting the data live, and then they create a wall map. Typically, post-it notes might be used for something like this. Once a current state is done, there might be some hand calculations or perhaps some spreadsheet calculations for the key metrics like lead time, takt time, inventory & capacity, that help quantify areas of waste. These calculations can be tedious to do. With the analysis done, and based on the experience of the people in the room, we start identifying opportunities for improvement. And that's typically put on the map as a kaizen burst. And you might do some additional validation on some of these ideas, again using spreadsheets or hand calculations. Then you select which of these improvements to make and think about what the future state map looks like after those improvements. Then using the current state, the future state, and the projects that you want to do, you would report out and then would create an implementation plan for 90 days, 120 days, whatever the time period is. So let's look at the challenges of running improvement events like this in co-located and remote work environments.
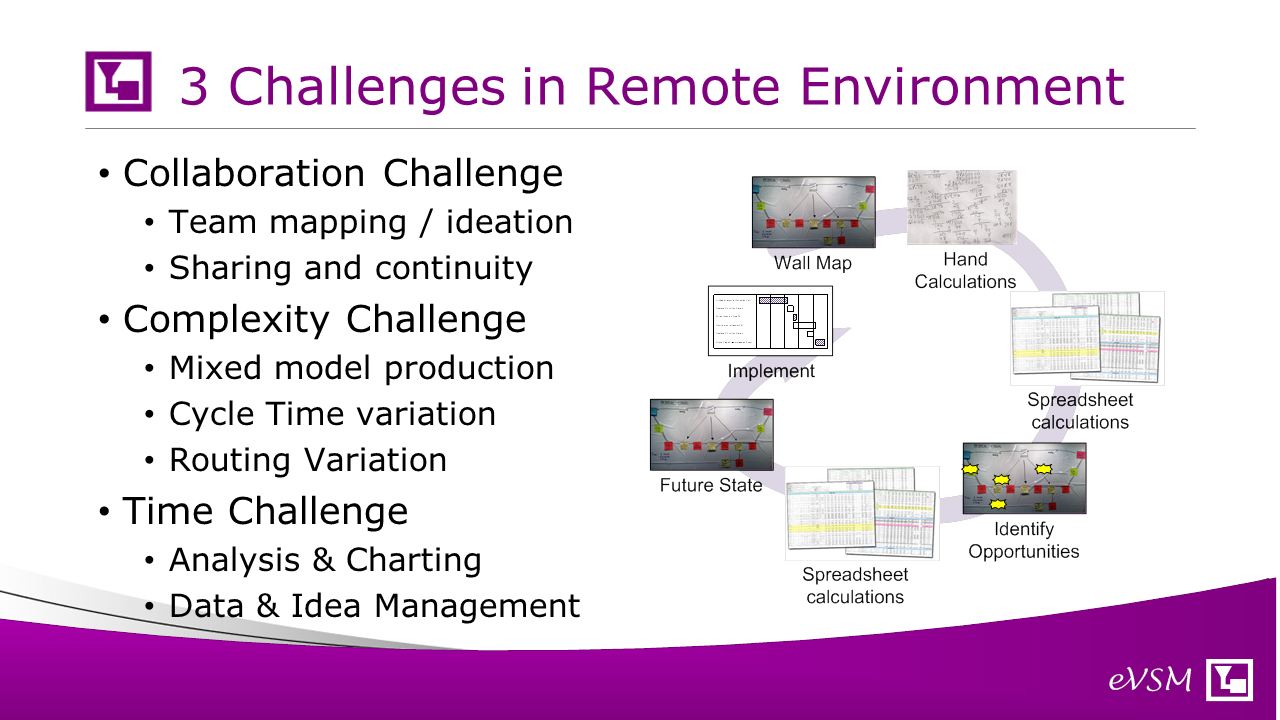
We can identify 3 major challenges. The first is a collaborative capability. A huge advantage of in-person VSM events is getting people co-located in a room and having them brainstorm and produce a map together. They can build on each others' ideas and work concurrently on the wall with markers and post-its.
So how do we do that in the virtual environment? And there's an additional problem with sharing and continuity. It’s not practical to run a three-day event in a virtual environment. Typically, we might break up in shorter sessions. So how do you assure continuity between sessions?
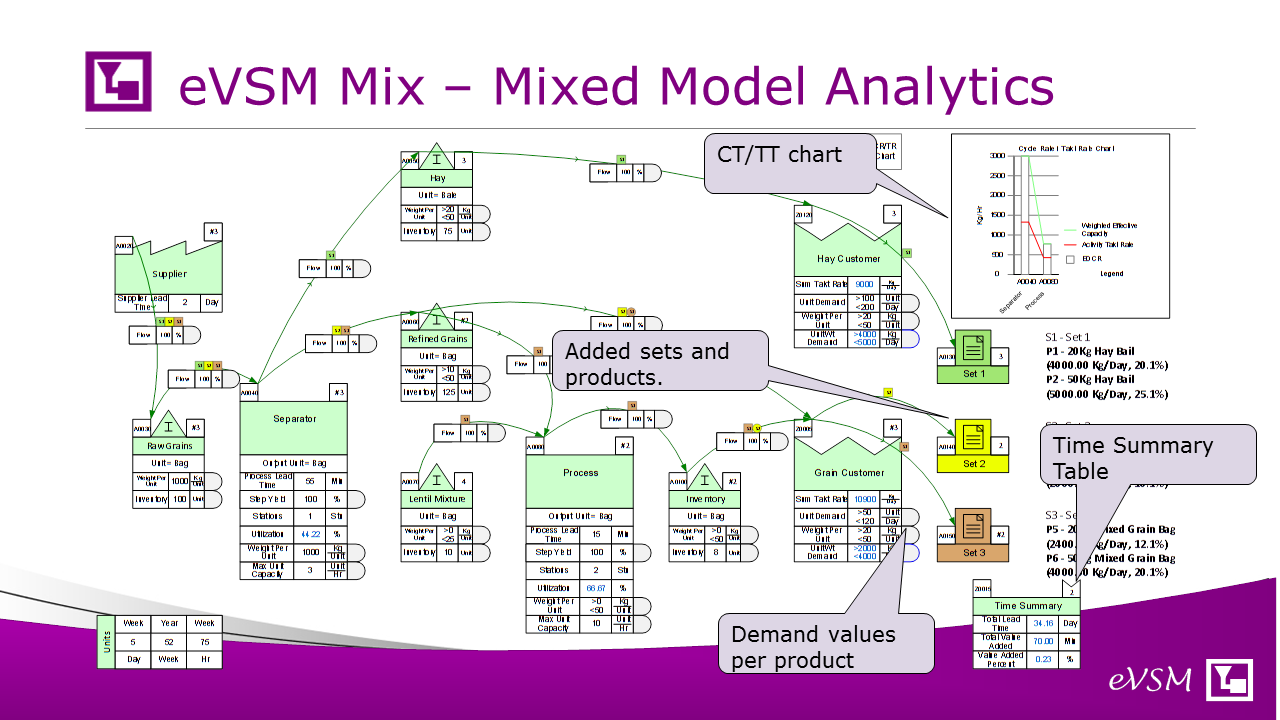
The second challenge is a complexity challenge. Today, perhaps 95% of the production value streams we see are mixed model value streams. This necessitates discussion on what is it that we're going to map what are we collecting data for and how that will represent the value stream as a whole. Do we map each high-runner product or create some averaged product family? What if products have variations in routing? What if they have different operational times? And finally, it’s a challenge to use people’s time effectively.
We have learned to visualize the waste by looking at flow stoppages, lead time, capacity CT/TT charts, resource balance charts, and so on. It's tedious and time-consuming to do in a room working together and does not get easier in a remote environment. It’s also time-consuming to manage all the input data and the improvement ideas.
So we've talked about the challenges in our virtual environment, now let's look at what process we could follow to resolve these.
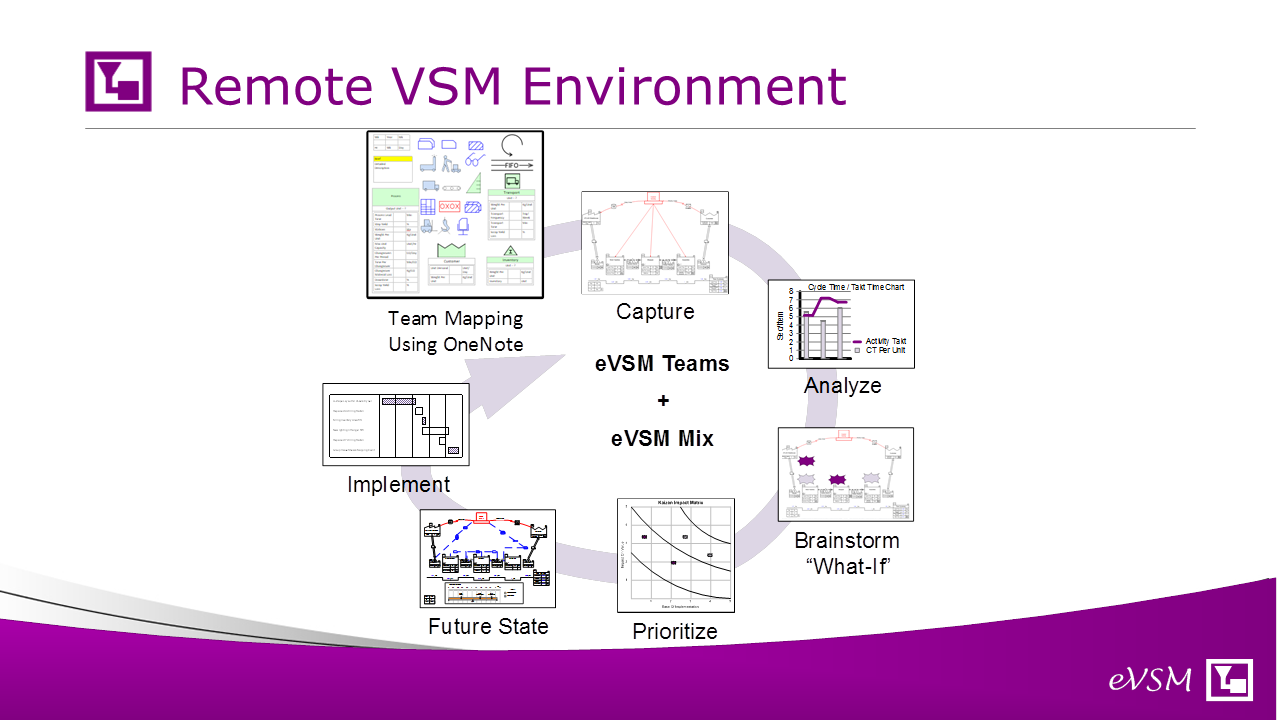
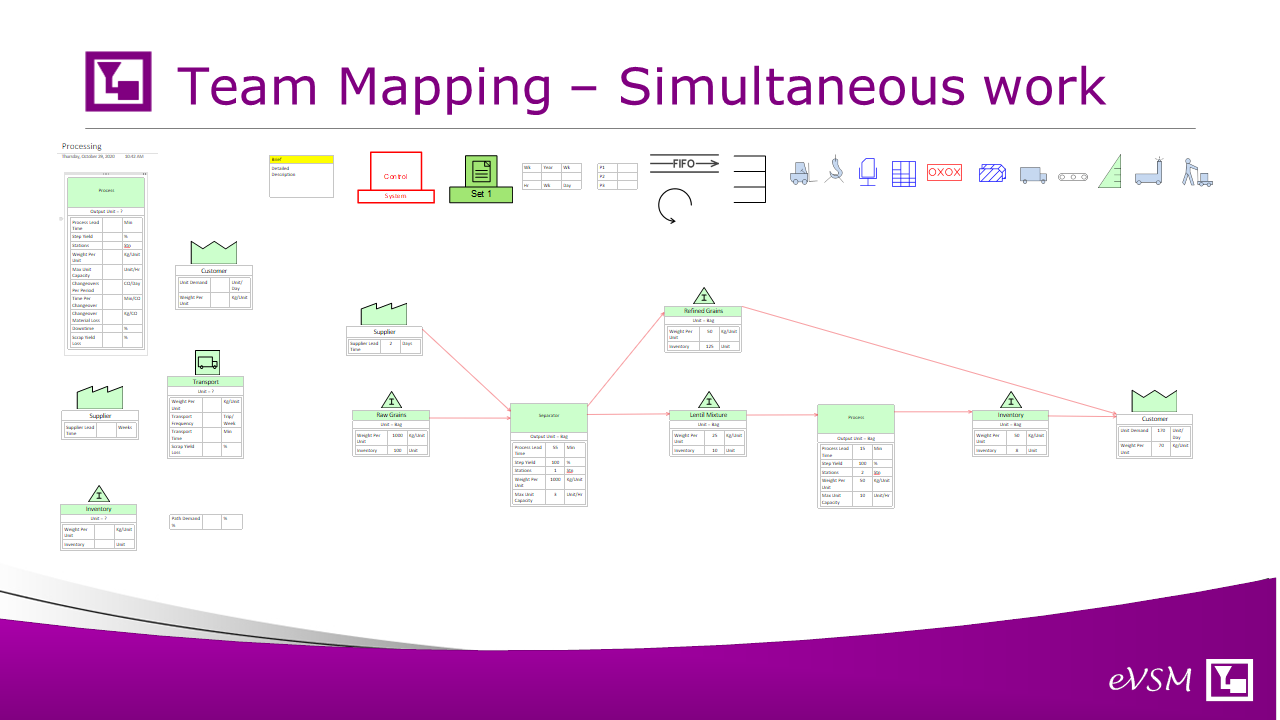
So imagine for a second that your remote environment had a whiteboard capability (Team Mapping using OneNote in the diagram). So your team is conferenced in over the network and are chatting and creating the map on the whiteboard. Each member can zoom in to a different area on the whiteboard and work on it simultaneously unlike a simple screen sharing over a web conference. The whiteboard has the VSM icons with variables all on there and you could draw with a simple copy/paste. This whiteboard would be your equivalent of the normal wall map activity.
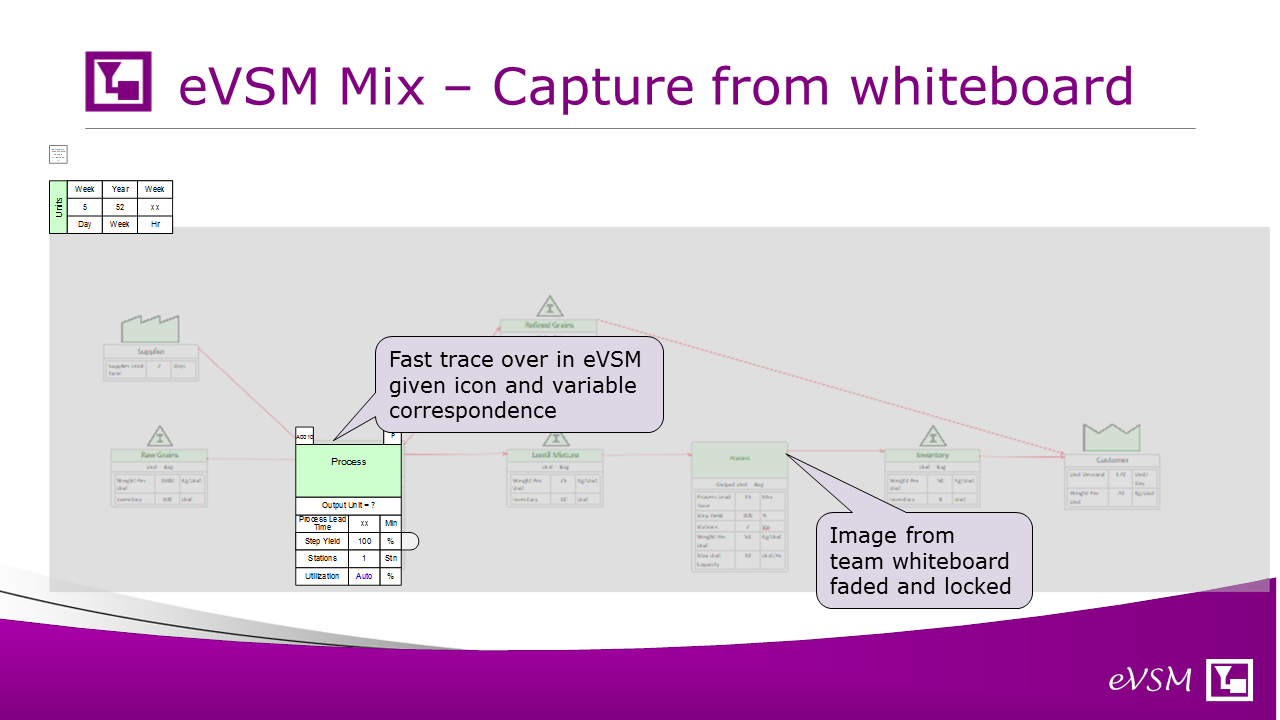
Once you had the map on the whiteboard you would make an image copy and then trace over it in the eVSM Mix software ('Capture' in the diagram above). This process is fast because the whiteboard icons and variables would correspond to those in eVSM. Also, eVSM Mix understands different products with different routings and different operational values, so you don't have to create multiple maps or make many simplifying assumptions.
You can use eVSM to complete any data input either directly or via a spreadsheet interface. Now the analysis and charts are just a button click away (Analysis in the diagram).
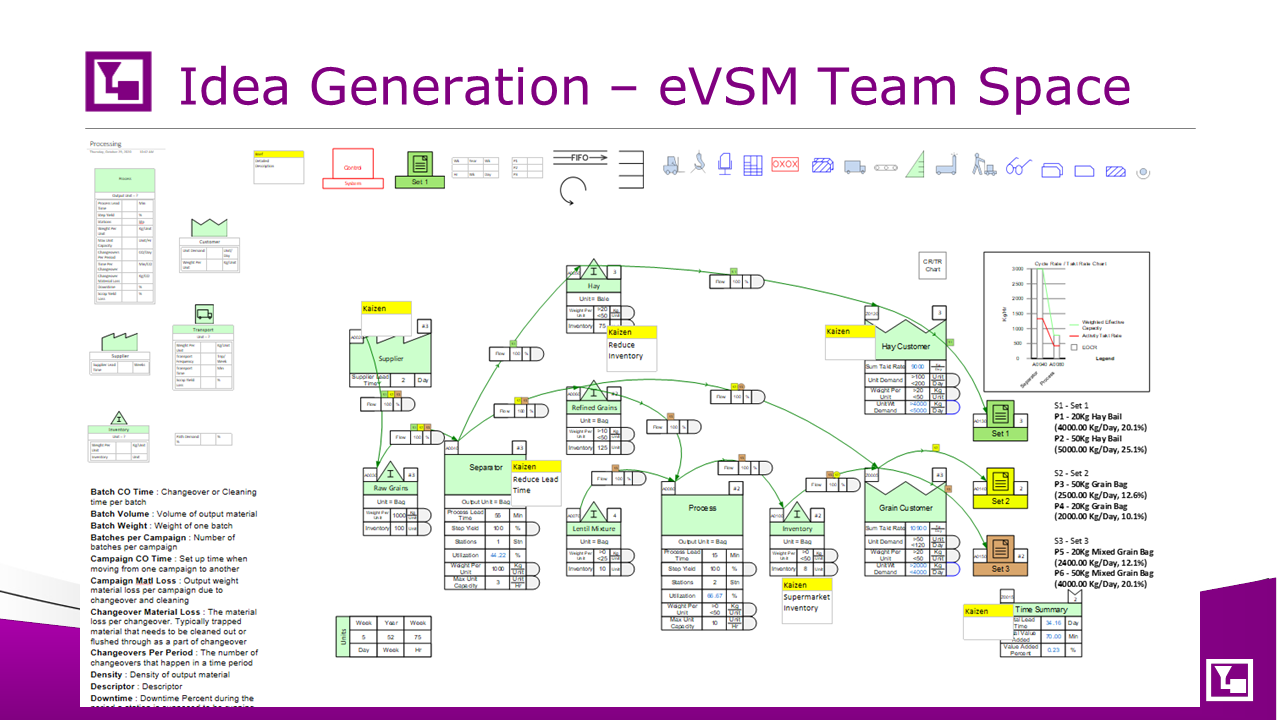
With analytics and visuals done, you can paste an image of the map back onto the whiteboard for usage in generating improvement ideas (Team Ideation in the diagram). Ideas can be posted using the electronic Post-it equivalents. As part of the ideation, one of the team can work on the eVSM map (or model) and can run what-ifs in response to ideas from the group. Once the group decides which ideas to pursue for the future state, the eVSM map can be copied and modified to become the future state, and an implementation plan created (Future State and Implement in the diagram). Let's see this flow in action for a simple map.
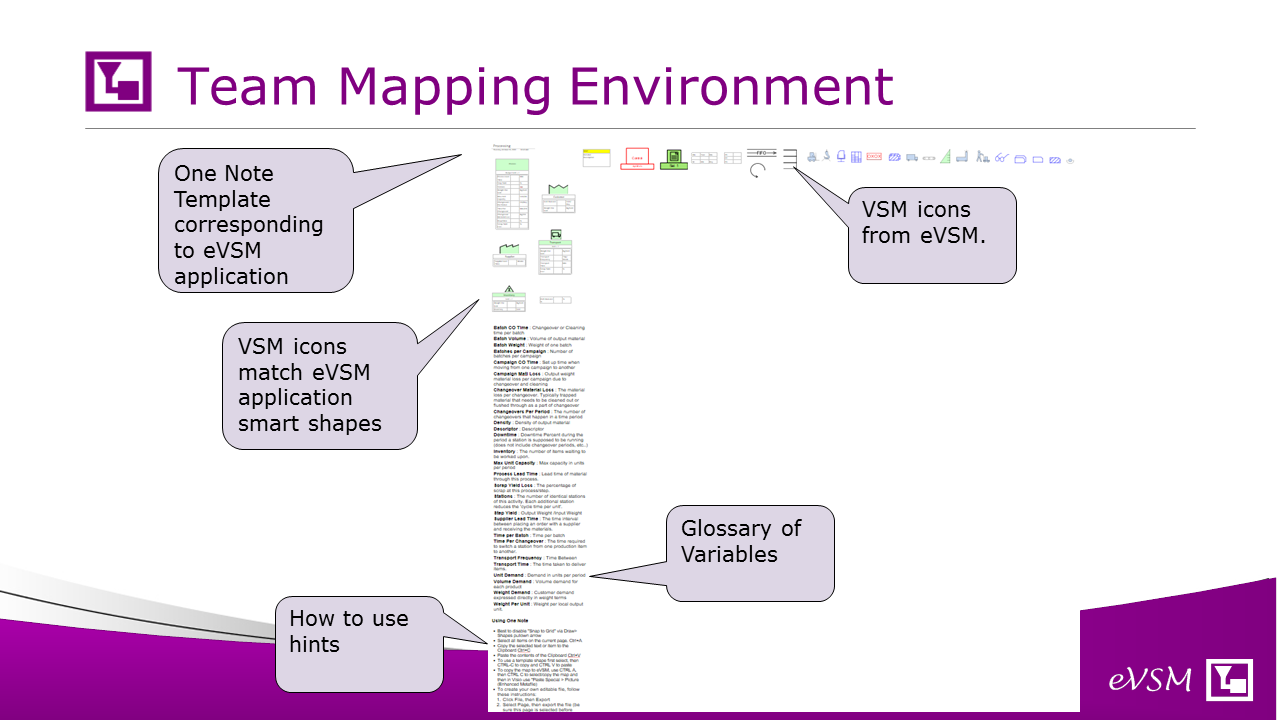
Depending on the type of value stream (manufacturing, processing, supply network, transactional, pharma) we open the corresponding team template in OneNote and share it with the team members we want to participate in the event. The map is created with copy, paste & edit of the icons in the template. Icons can easily be moved once placed via drag & drop. Individuals can zoom into different areas and work simultaneously. Instructions on how to use the template are included on the bottom left. The graphic shows the different areas of the template.
The team can work simultaneously to create the map. Sidebars on the shapes indicate the team members who have added any shape to the map. Once the map is ready, it is copied and then pasted into eVSM as a background graphic.
We can trace over the OneNote map in eVSM. The trace-over is fast because icons and variables all match since we started with an eVSM template in OneNote.
Once the map is captured, eVSM automates much of the related analytics. At this point we can take an image of the analyzed map and put it back in the team space where it can be leveraged by the team to generate improvement ideas that remove the waste and meet our business goals.
The team space allows members to post ideas (Kaizen's as a small yellow table) concurrently. The tables that can have author, priority, and any other useful attributes. We can color-code rows as needed.
In summary, Remote VSM using Microsoft Teams and OneNote can keep your improvement processes going even where team co-location for VSM Events is not possible. It's practical, and the related OneNote templates are available right now from the eVSM Group. Contact us at support@evsm.com. Our top 5 tips for using OneNote follow.
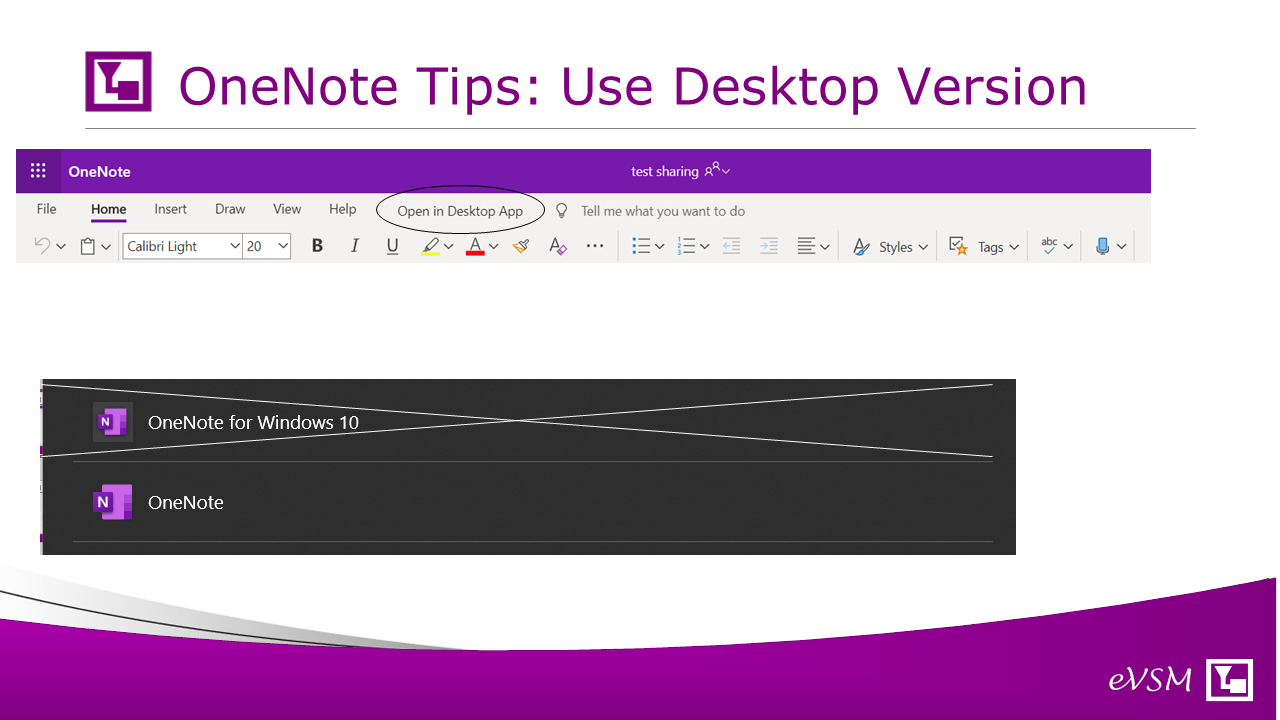
When opening a shared OneNote file first open the link from your email in your browser, and be sure you are logged in to your Microsoft account. Then from the browser select “Open in Desktop App”, be sure NOT to open OneNote for Windows 10 use the OneNote desktop version.
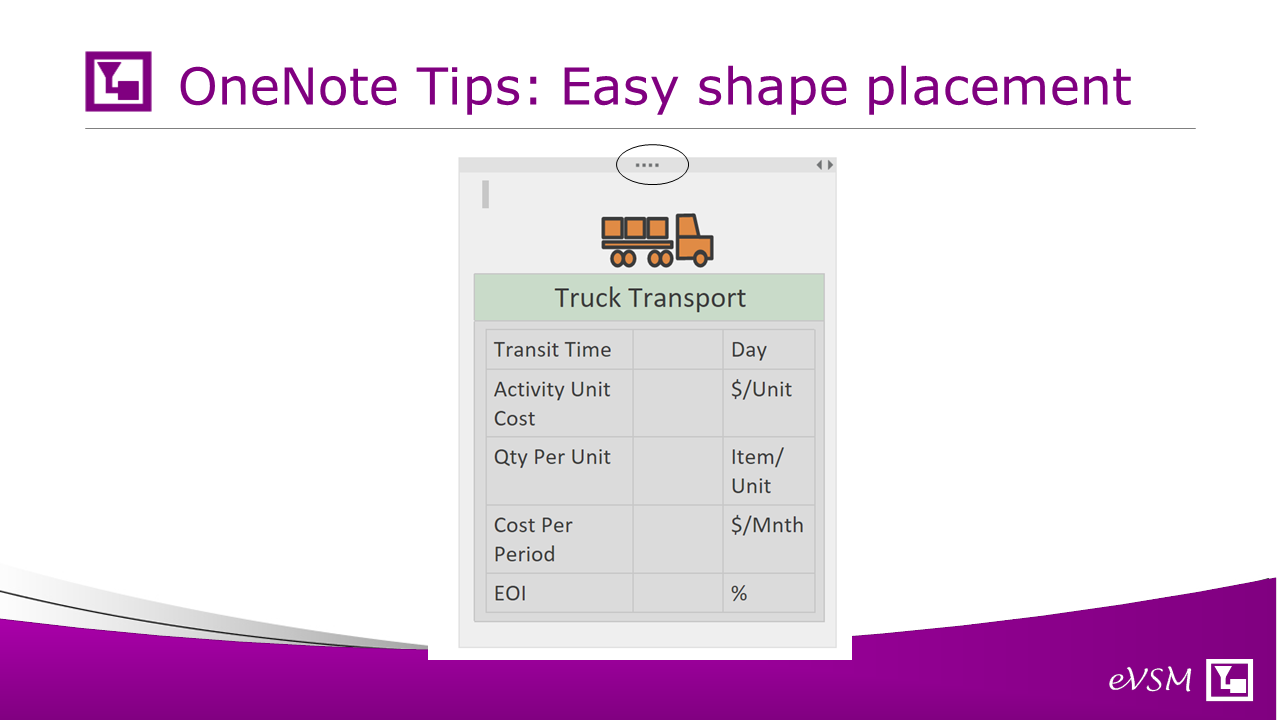
To use the OneNote template shapes you must select the whole shape and copy and paste onto your map. To select you can click on the gray bar at the top of the shape. Use CTRL-C to copy. Place the cursor at the desired location on the map and use CTRL-V to paste.
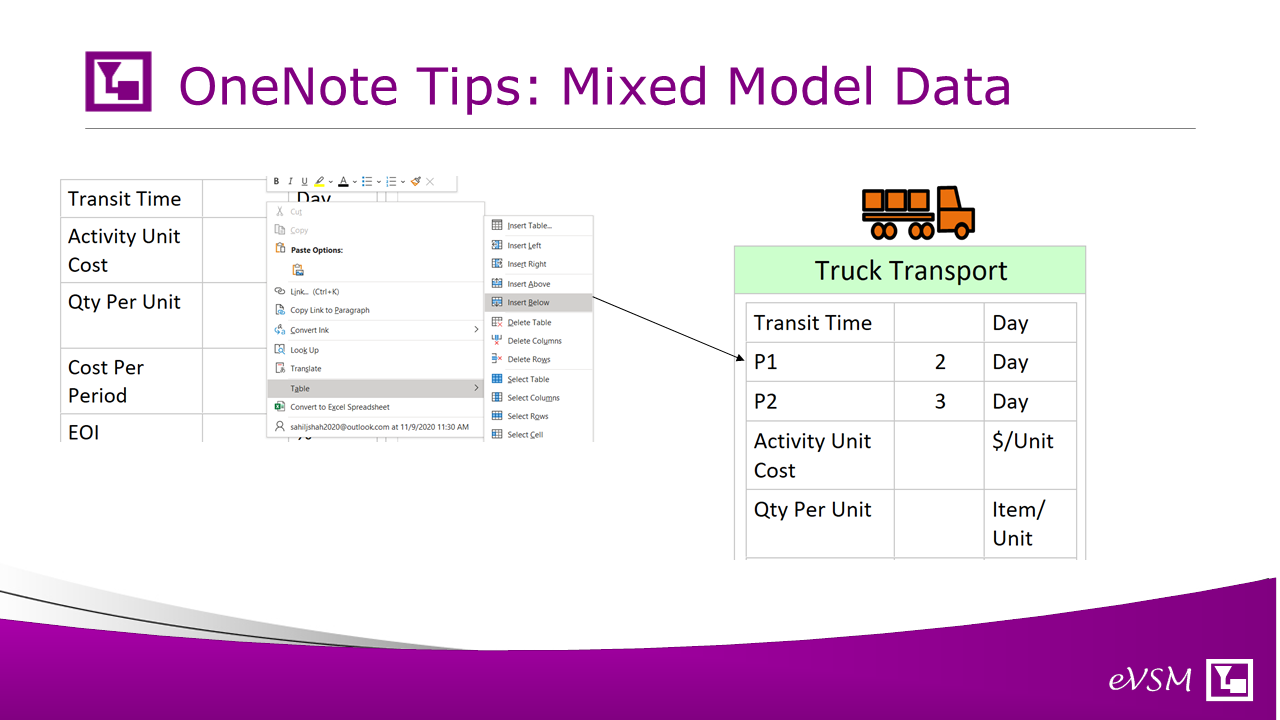
If any of the variable's values are product specific (as can occur in value streams making product variants), simply insert rows below the variable name to provide the product specific.
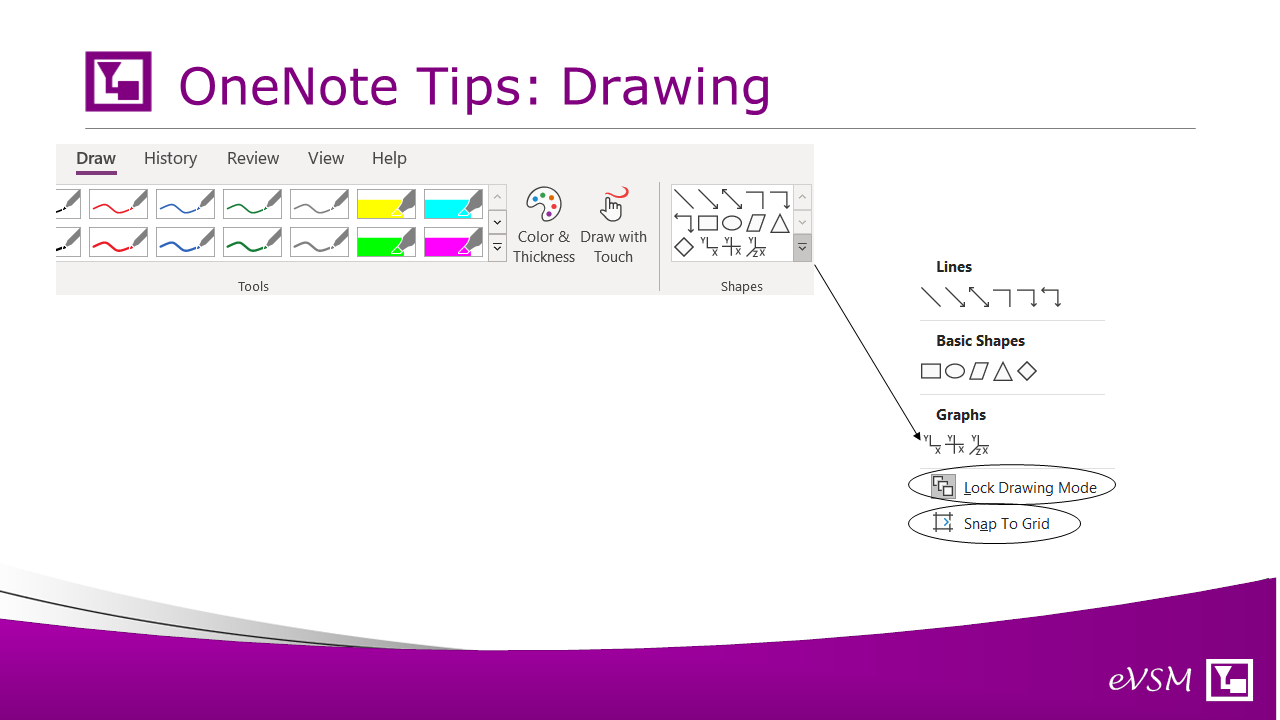
To make drawing easier in OneNote there are a couple capabilities that are useful, both located under the Draw->Shapes Pulldown. First, to increase flexibility and make drawing easier you can turn off snap to grid. Second, when drawing arrows you can toggle on ‘Lock to Drawing Mode’ to make drawing multiple arrows easier. You must unlock this once the arrows are drawn.
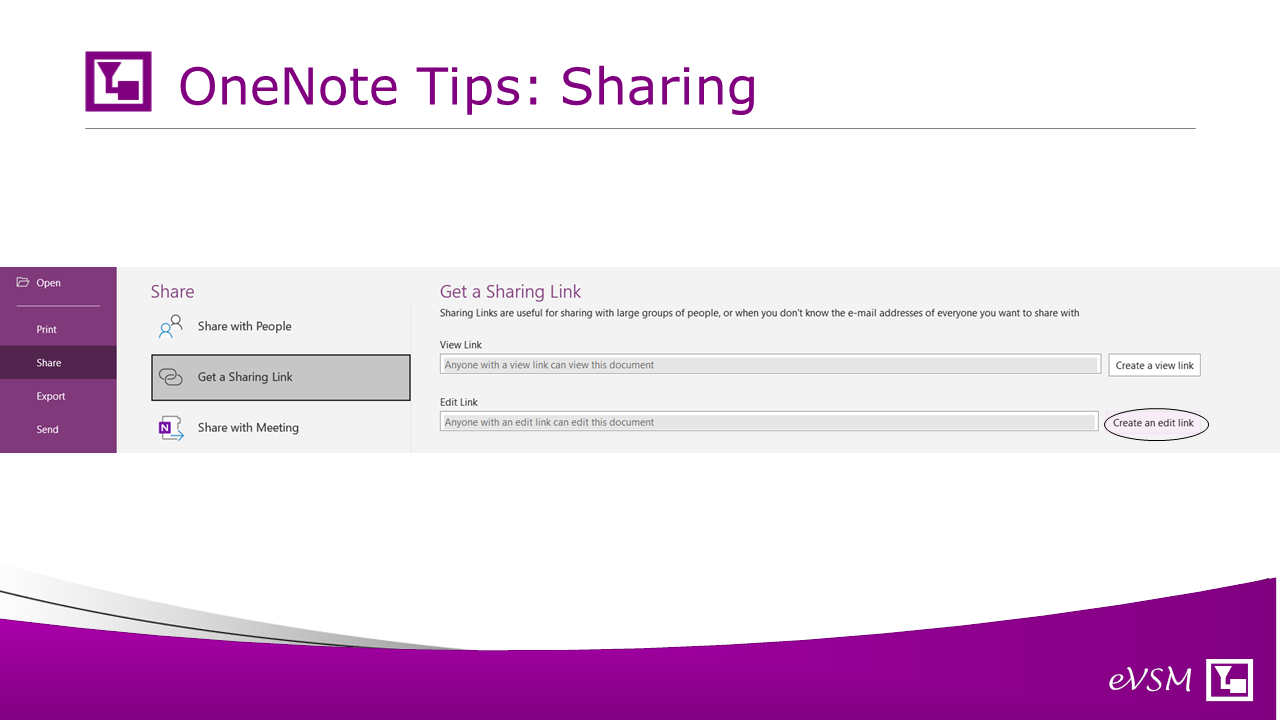
To share a OneNote file with you colleagues you can click File>Share>Get Sharing Link. Select Create an edit link, copy the link, and email it to your colleagues.
OneNote Template
You can download the OneNote template file here. The single download includes templates for plant manufacturing, plant food & chemical processing, pharma vsm, transactional vsm, and supply network design. Usage instructions are included in the file.