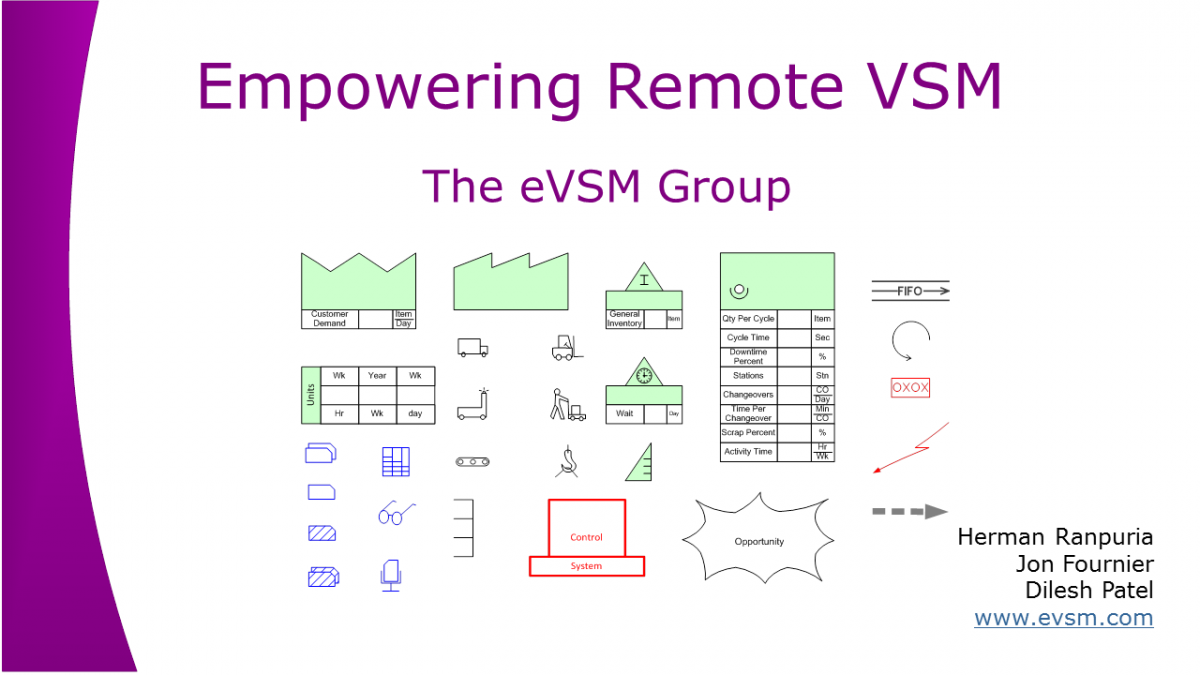
Overview of Remote VSM
Now is an unsettled time in businesses around the world. After all, many companies are busier than ever, and need to work to rapidly re-deploy or increase capacity, and navigate disruptions in their supply chains. Typically, such problems and improvements see their best results when done in person, with digital technology playing a supporting role. However, with people limiting travel and physical interaction, technology can come forward to provide a larger role in facilitating the communication needed to affect results.
On Wednesday, April 8, 2020, we delivered a webinar showing how it's possible to have a team create a virtual 'whiteboard value stream map' using Google Drawings (we can also use the Microsoft OneNote environment instead). We then showed how to take the resulting whiteboard map into eVSM, where we could analzye the map and see where capacity is used, limited, and available.
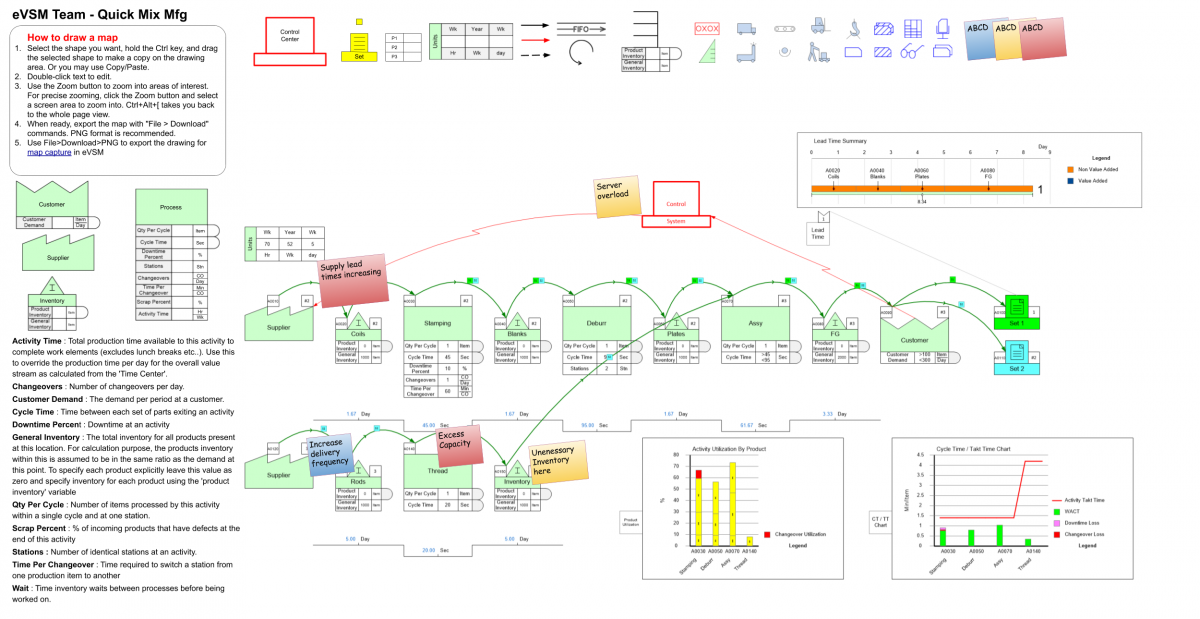
eVSM's Mix Mfg sketching icons in Google Draw
It's easy to see that, rather than spending 3 days in a conference room building a map, a team could meet periodically for an hour to collaborate on the map in Google Drawing. Then the team can break, while one or two people work on transferring data into the eVSM environment, performing analysis, and then back-filling the Google Drawing with charts and analysis to discuss in the next session. So, over the next few days, the team ends up with: a current state with great visuals highlighting capacity/lead time/cost problems, a canvas for collecting improvement ideas, and ultimately, a future state plan for implementation.
Remotely facilitating value stream mapping sessions will take some adjustment, but the good news is you can apply continuous improvements to this process as well (which you probably do anyways!). There's no better time to look at how electronic tools can aid the improvements critical to your enterprise.
Resources

Empowering Remote VSM for Plant Production - Webinar Transcript
 |
| Welcome to a webinar on empowering virtual value stream mapping. My name is Dilesh patel and I will be joined on the webinar by my colleagues Herman and Jon. Our eVSM group has been providing tools for Lean and VSM for the past two decades but it’s really only the past four weeks that we have seriously looked at remote VSM development. As you will see, we have been pleasantly surprised by what is possible. |
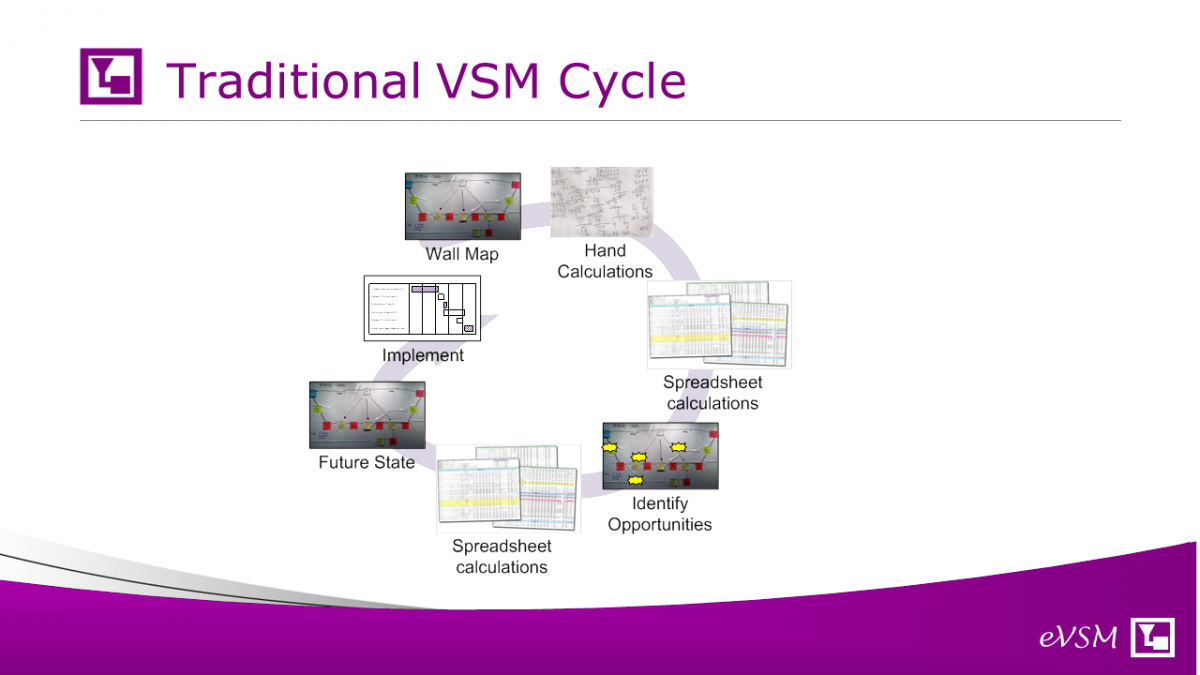 |
| Let's start with looking at the traditional VSM event and improvement cycle. Something we have seen in many companies. It's a physical event that starts with a wall mapping activity with people gathered in a room. A value stream charter is created in advance. So the goals, start and end points of the map are clear and there are people in the room who are familiar with pieces of the value stream being mapped. |
| The team walks the value stream, if possible, collecting the data live and then they create a wall map. Typically, post-it notes might be used for something like this. Once we get a current state map down, there might be some hand calculations or perhaps some spreadsheet calculations for the key metrics like: lead time, takt time, inventory & capacity, that help quantify areas of waste. These calculations can be tedious on realistic maps. |
| With the analysis and based on the experience of the people in the room, we start identifying opportunities for improvement. And that's typically put on the map as some kind of kaizen burst. And you might do some additional validation on some of these ideas, again using spreadsheets or hand calculations. Then you would select which of these improvements to make and you would think about what the future state map looks like after those improvements. |
| And then using the current state, the future state, the projects that you want to do, you would report out and you would create an implementation plan for 90 days, 120 days, whatever the time period is. |
| So let's look at the challenges of running improvement events like this in co-located and remote work environments. |
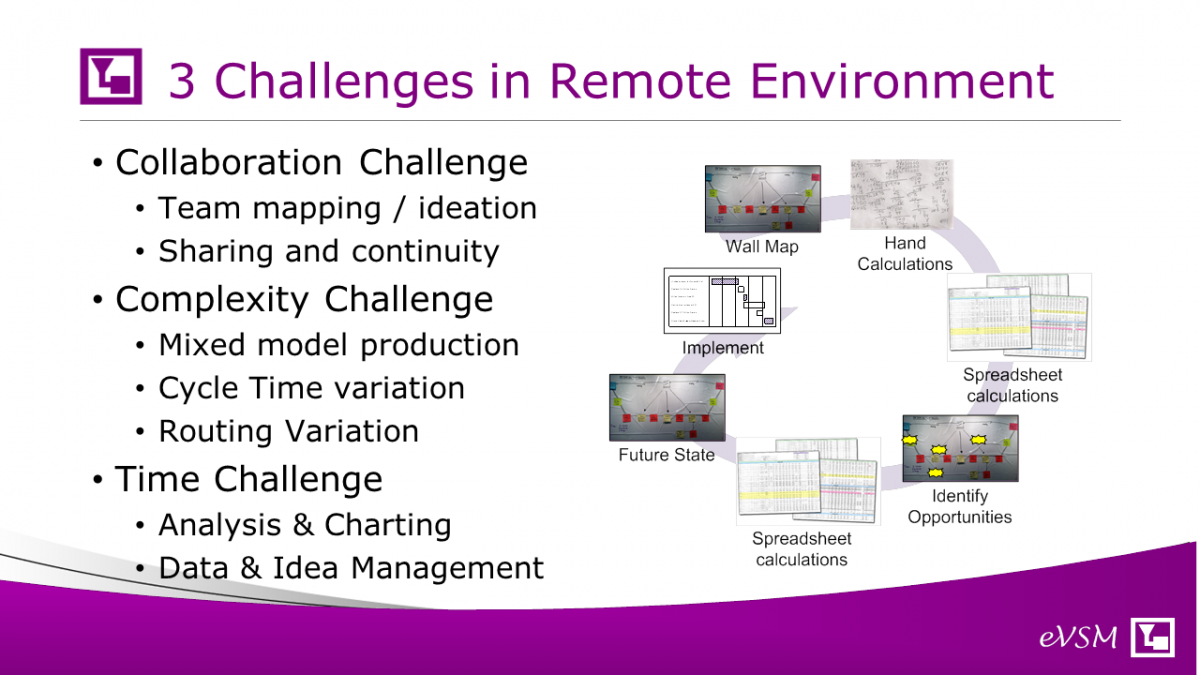 |
| We can identify 3 major challenges. |
| The first is a collaborative capability.There's a lot of goodness associated with getting people co-located in a room and having them brainstorm and come up with a map together. They can build on each others ideas and work concurrently on the wall with markers and post-its. So how do we do that in the virtual environment? And also there's an additional problem with sharing and continuity. We're not going to run a three day event in a virtual environment. Typically, we might break up in shorter sessions. So how do you assure continuity between sessions? |
| The second challenge is a complexity challenge. Today, most of our value streams, at least for production, are mixed model value streams. Perhaps 95% or so. This necessitates discussion on what is it that we're going to map and what are we collecting data for and how will that represent the value stream as a whole. Do we map each high runner product or create some averaged product family? What if products have variation in routing? What if they have different operational times? |
| And finally, there's the time challenge. We have learned to visualize the waste by looking at flow stoppages, lead time, capacity CT/TT charts, resource balance charts and so on. It's tedious and time consuming to do in a room working together, and does not get easier in a remote environment. It's time consuming also to manage all the input data and the improvement ideas. |
| So we've talked about the challenges in our virtual environment and now let's look at what process we could follow to resolve these.. |
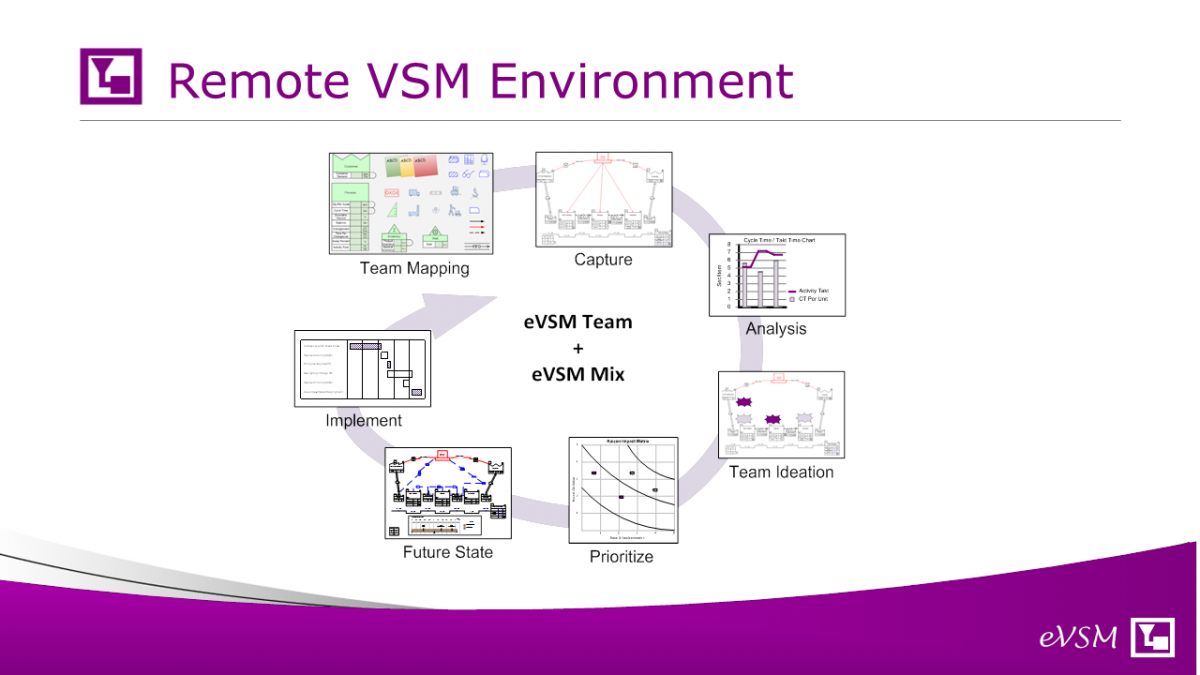 |
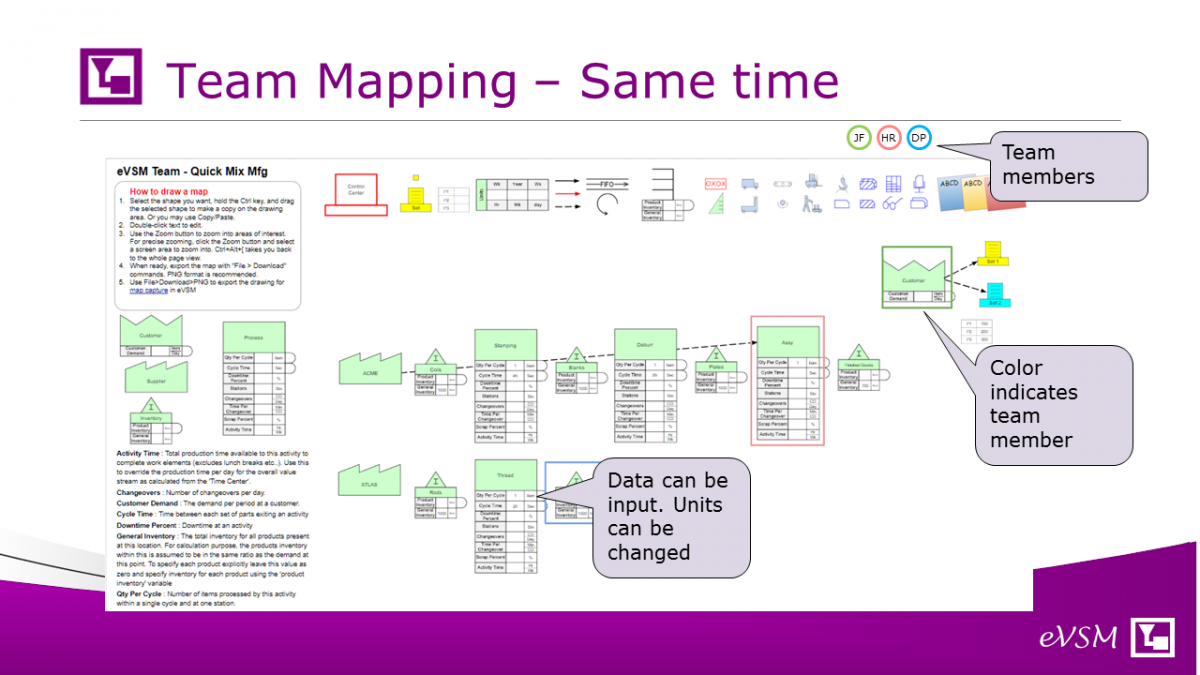
| So imagine for a second that your remote environment had a whiteboard capability (Team Mapping in the diagram). So you all dialed in over the network and are chatting and creating the map on the whiteboard. It has the VSM icons and the variables all on there and you could draw with simple drag & drop. And you could work simultaneously just like you might be working with a physical board. This is would be your equivalent of the normal wall map activity. |
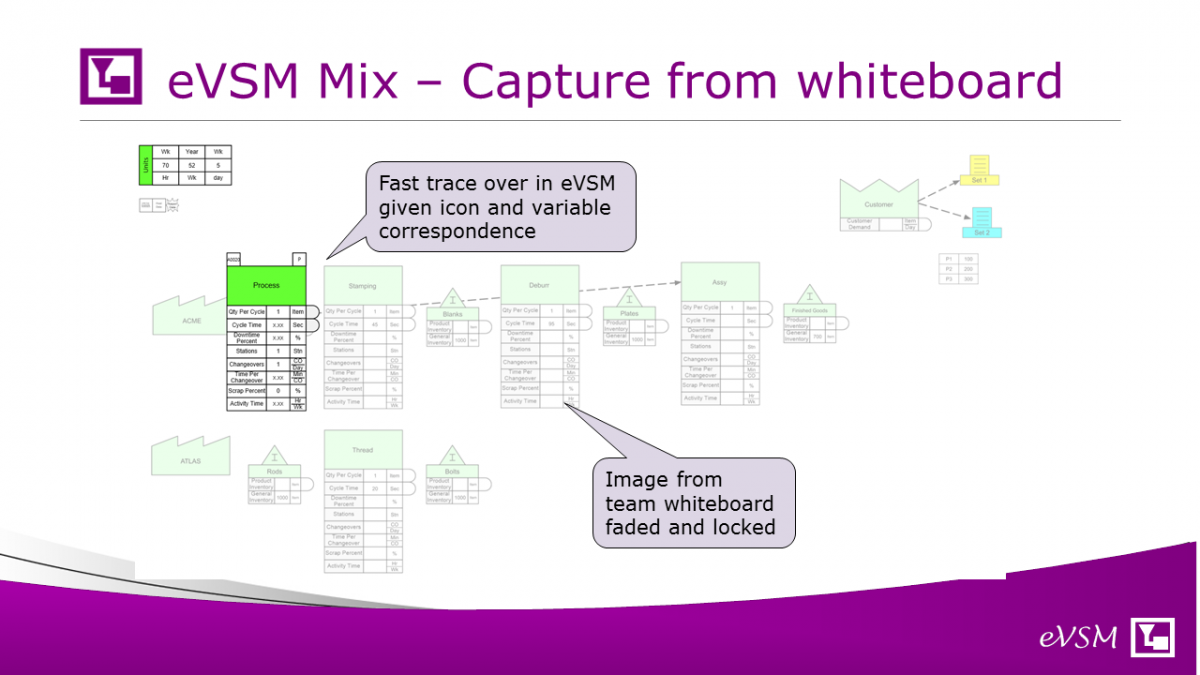
| Once you had the map and with perhaps some of the data you would make an image copy and then trace over it in the eVSM Mix software (Capture in the diagram). The process would be fast because the whiteboard icons and variables would correspond to those in eVSM. Also eVSM Mix understands different products with different routings and different operational values so you don't have to create multiple maps or make lots of assumptions. You could use eVSM to complete any data input either directly or via spreadsheet interface. Now the analysis and charts would be just push buttons away (Analysis in the diagram). |
| Now you can make a copy of the map with analytics and visuals and paste it back onto the whiteboard for usage in generating improvement ideas (Team Ideation in the diagram). Ideas can be posted using the electronic post-it equivalents, color coded as needed. |
| As part of the ideation, one of the team has the working eVSM map (or model) and can run what-ifs in response to ideas from the group. Once the group decides which ideas to pursue for the future state, the eVSM map can be copied and modified to become the future state, and an implementation plan created (Future State and Implement in the diagram). |
| Lets see this flow in action for a simple map.. |
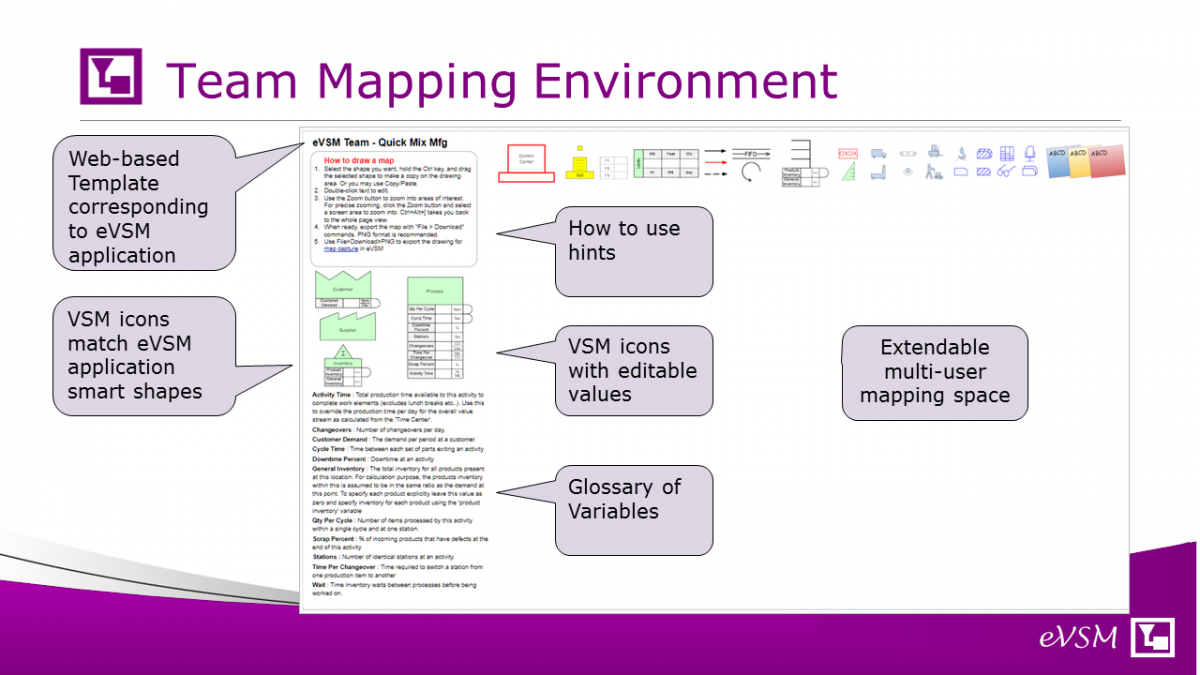 |
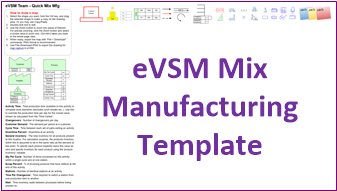
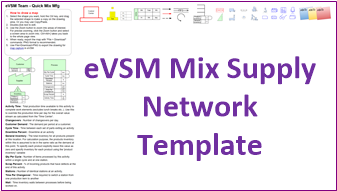
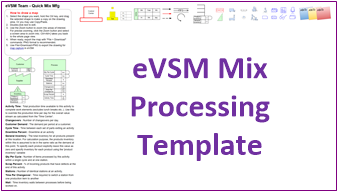
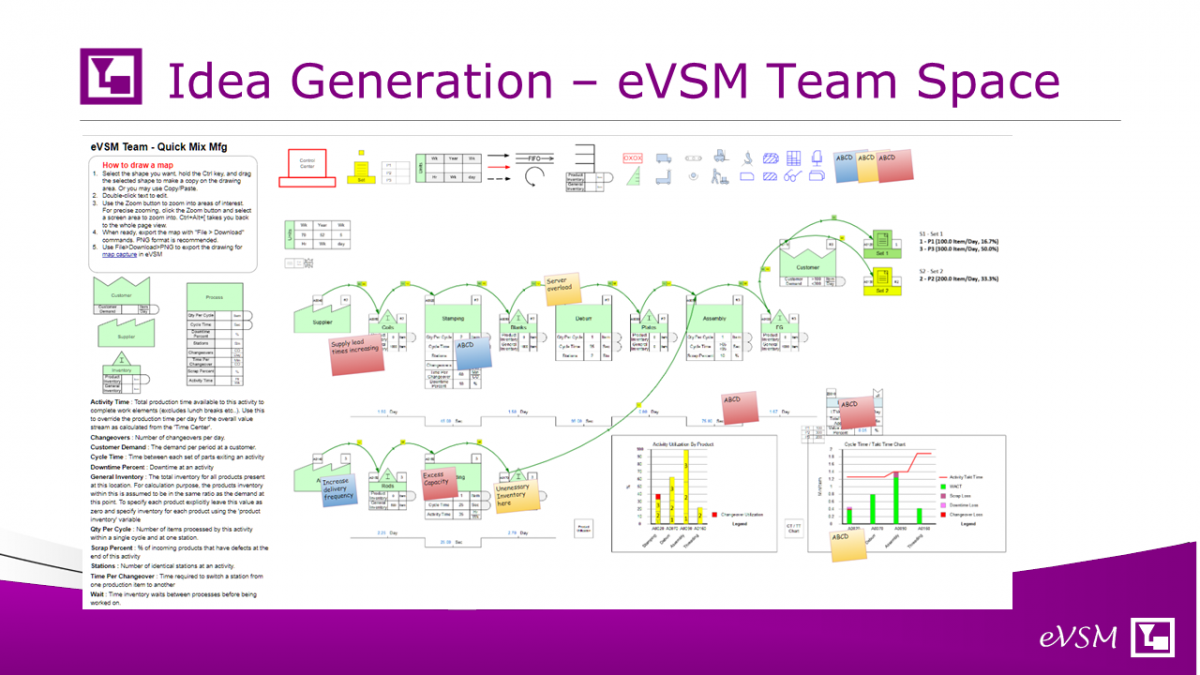
| Depending on the type of value stream (manufacturing, processing, supply network, transactional) we open the corresponding team template in the web browser and share it via email addresses to the team members we want to participate in the event. |
| The map is just created with drag, drop & edit of the icons in the template. Individuals can zoom into different areas and work simultaneously. Instructions on how to use the template are included on the top left. |
| Here's a simple map created by a team of 3 in a few minutes: |
 |
| The next step is to save the map to an image file and use the "Wall Map" button in eVSM to make it a background that can be traced over with the eVSM shapes. The team has one or two designated members who have become proficient in eVSM through its eLearning module. They can be internal to the company or service providers from the eVSM group. |
| Here is the map eVSM at start of traceover. The traceover took 10 minutes and then a further 5 minutes in data input via the eVSM Excel interface to build the map. |
 |
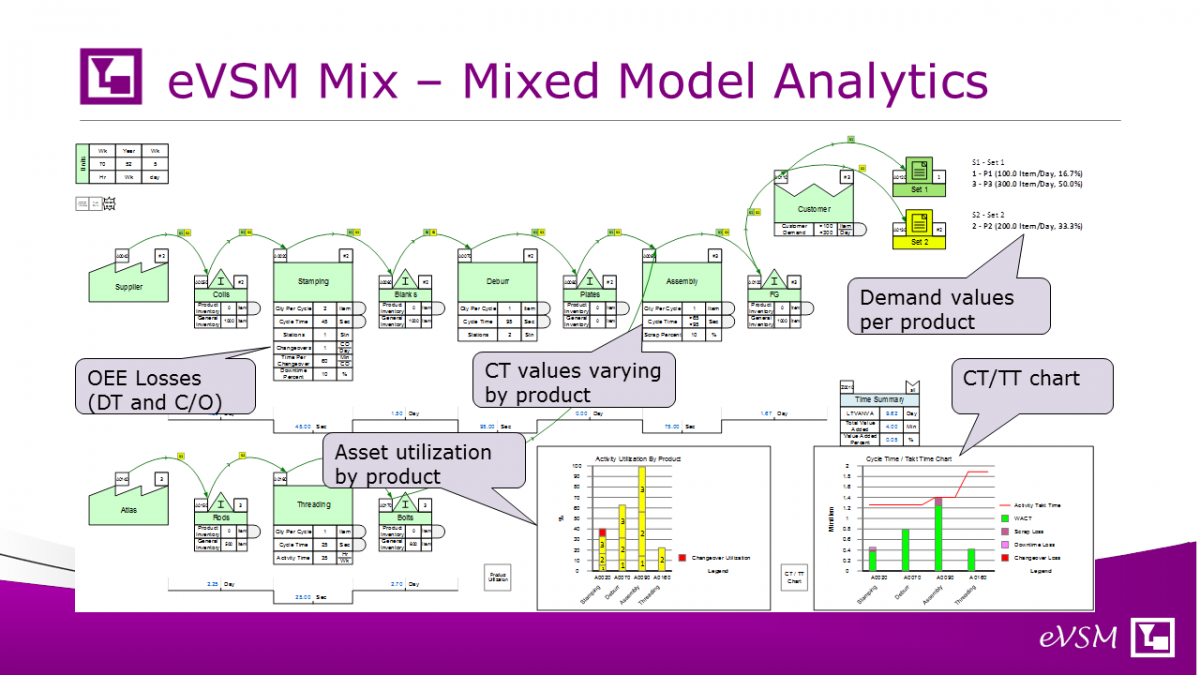
| Here is the captured map after we "solve" for the lean metrics using the built-in analytics. Capture, solve, charting took 15 minutes. |
 |
| The map would be shared with the team initially via web conference so that changes could be made in eVSM by the author. |
| For example, we have limited the Turning process to 1 shift and after discussion entered in some of the OEE losses and decide to specialize the cycle times at assembly because of significant variation by product. |
| At this point we can take an image of the map and put it back in the team space where the analytics can be leveraged by the team to generate improvement ideas that remove the waste and meet our business goals. The team space allows them to post ideas concurrently. |
 |
| In summary, we have tried to show you how to run a virtual VSM session in a way that allows the whole team to contribute, takes advantage of VSM capture and analytics automation, and creates a value stream model that you can continue to work with and on which you can do "what-if" studies. |
| If you want to understand the nuts and bolts of how to deploy for your team just contact us by emailing support@evsm.com. What we propose is effective, affordable and we think will have a part to play even after the COVID-19 crisis ends. |
Google Drawings Environment
Google Drawings is a free service which allows you to collaborate on a value stream map as a team. A Google account is required for saving your work (you can set up an account using your current email address), and keeps your data private. Google Docs has robust sharing and permission settings, so it's possible to allow external collaborators, but it's advisable to only share your data with specific email addresses.
If you'd like to access the Google Drawings templates we've created, contact us. We will create a new copy of the base drawing and share it with you.
Google Drawings Setup Instructions
- From the list in the Resources table, select the template which best matches your value stream. Click the link to open the template with View Only privileges.
- You will then open the template, and choose File->Make a Copy. Name the document, and make sure 'share with the same people' is unchecked (otherwise we will have access to your data!)
- From that new document, you can choose to customize it as your own template, and then start making copies to share with your collaborators