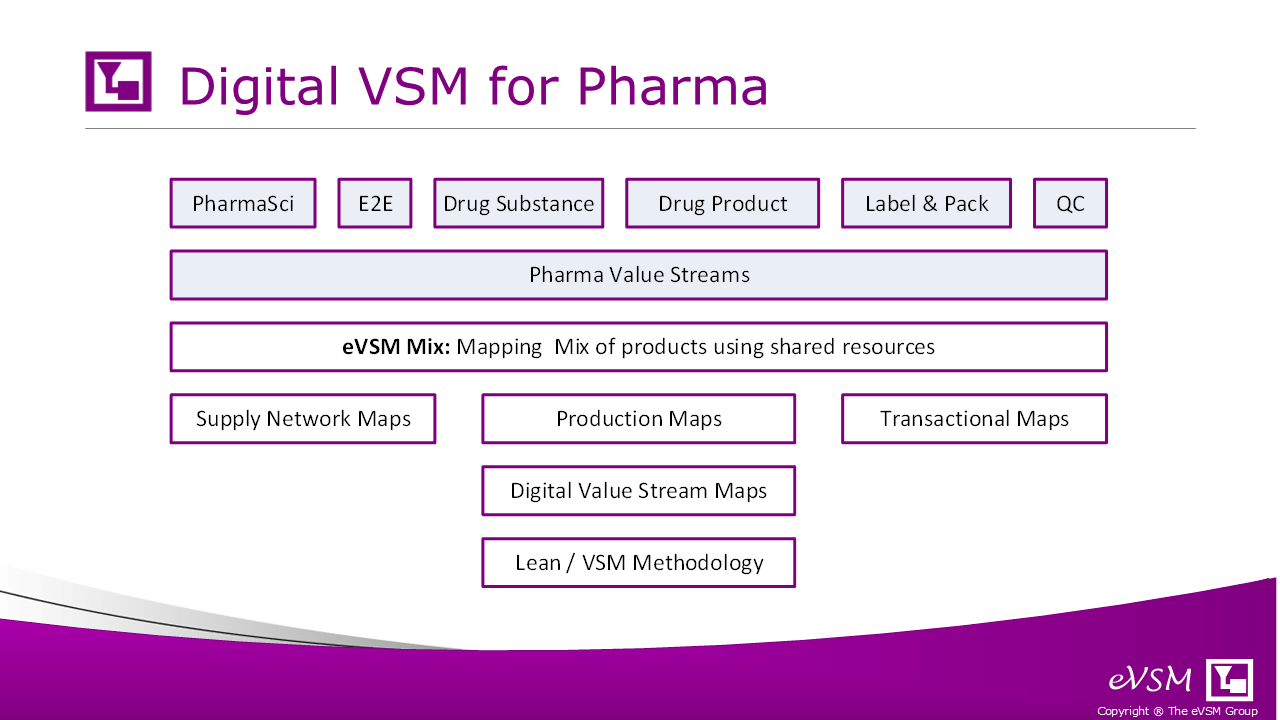
In close collaboration with our pharmaceutical clients, the eVSM team has developed tailored vertical applications designed specifically for pharmaceutical value streams. These solutions leverage industry-specific terminology and automatically calculate key performance indicators critical to pharma operations. The result is a more intuitive, impactful, and efficient approach to value stream mapping for pharmaceutical organizations.
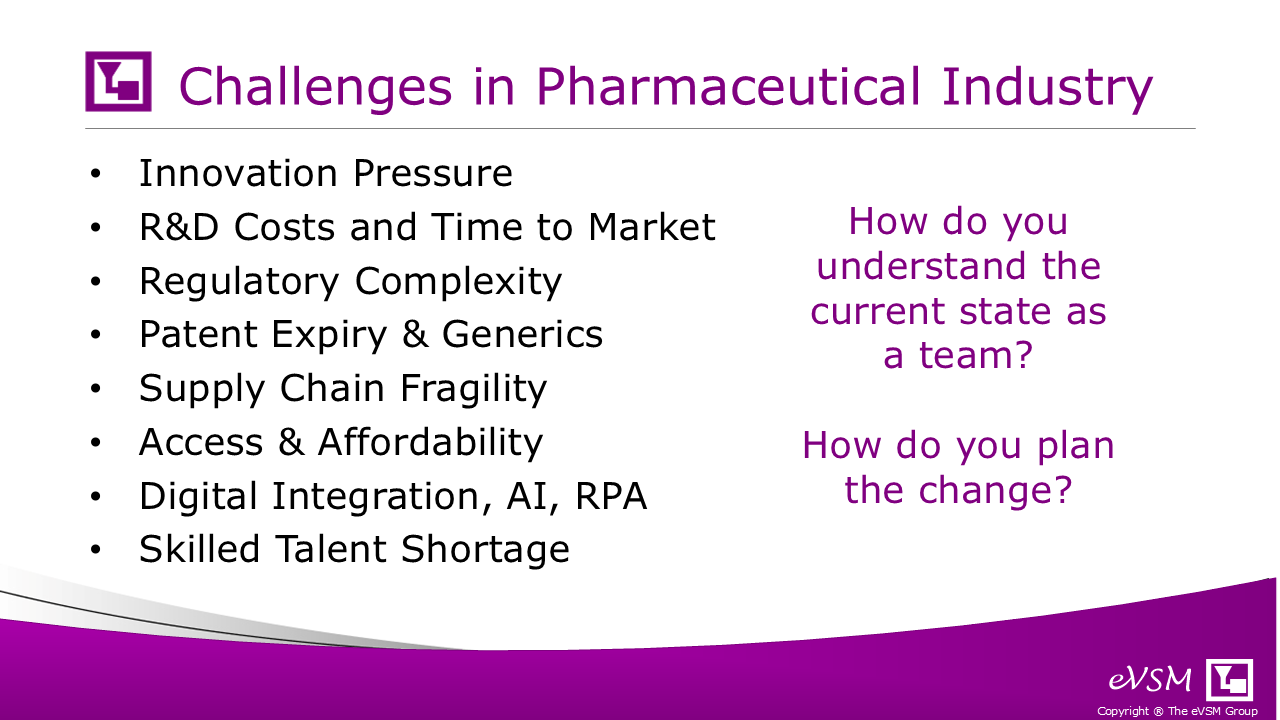
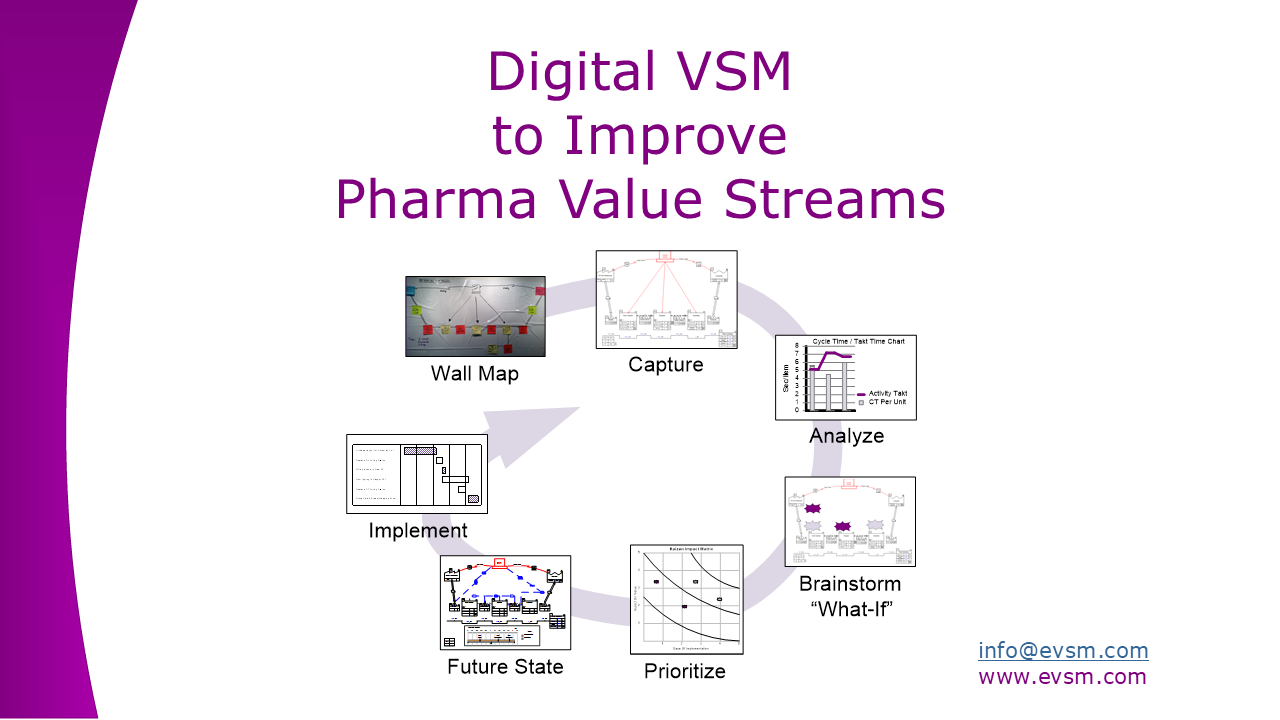
The pharmaceutical industry is evolving rapidly—driven by innovation, regulatory shifts, and digital disruption. A major challenge for teams is gaining a shared understanding of current operations. Without this alignment, driving meaningful change is tough. As highlighted in the webinar, agreeing on both the current state and future direction is essential.
Digital value stream mapping (VSM) helps by making complex processes visible and aligning teams around improvement efforts. In the following sections, we’ll explore vertical maps built specifically for Pharma. While based on generic (non-proprietary) data, each is rooted in real-world production scenarios.
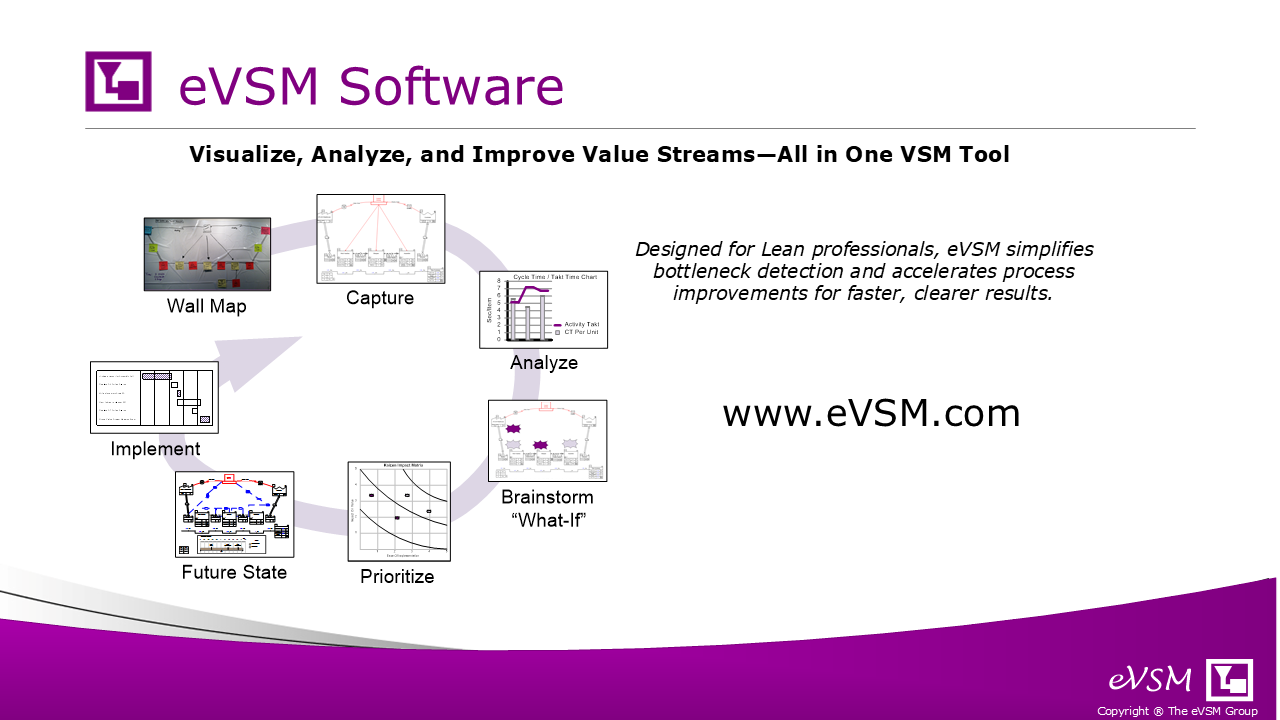
Here’s a quick look at how we developed a vertical solution for the pharmaceutical industry. Value Stream Mapping (VSM) has long been a cornerstone of lean initiatives, offering a metrics-driven view of processes and highlighting sources of waste. We introduced eVSM with basic VSM icons around 2000, and later integrated it with Excel to add analytical capabilities.
Our journey began with production mapping. Over time, we expanded the platform to include modules for supply network and transactional value streams. A major leap came with the introduction of Mix Modeling, allowing users to map multiple product variants using shared resources on a single map. That’s when the solution became both easier to use and significantly more powerful—leading to the name “eVSM Mix.”
This foundation set the stage for our collaboration with Pharma companies, where we began designing tailored maps for different areas of the industry. Let’s now take a look at some generic examples of these maps.
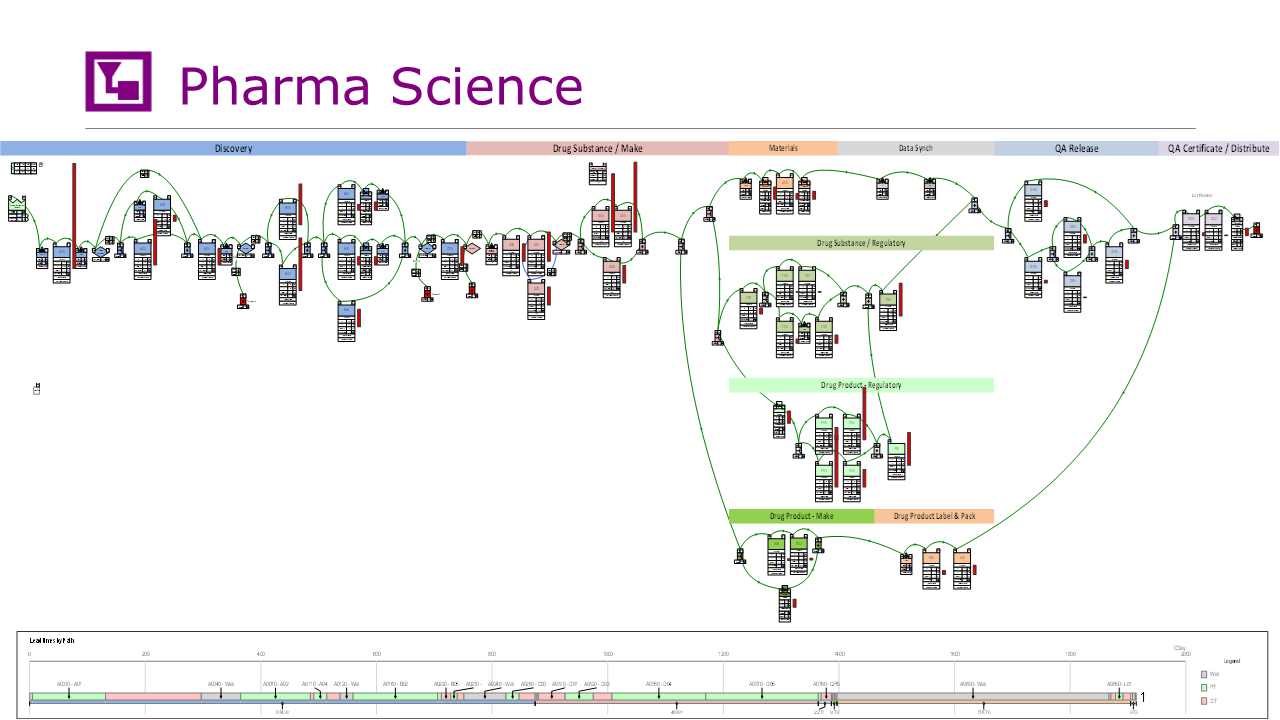
This map focuses on the full drug development process in Pharma—a complex journey from discovery through manufacturing, regulatory review, and distribution. One key feature is the lead time ladder along the bottom, which highlights the critical path through the value stream. It helps teams pinpoint delays and understand how each phase affects overall time-to-market.
Red bars on the map correspond to lead time segments, flagging bottlenecks and non-value-added time in areas like Drug Substance Make or QA Release. The model can also be segmented, allowing teams to zoom in on specific processes and see how much time is spent in each using the category function.
Another valuable feature is the ability to distinguish between actual processing time and total lead time. This makes it easier to see the value-added ratio in each phase, uncover inefficiencies, and identify opportunities for faster, more efficient tech transfer and delivery.
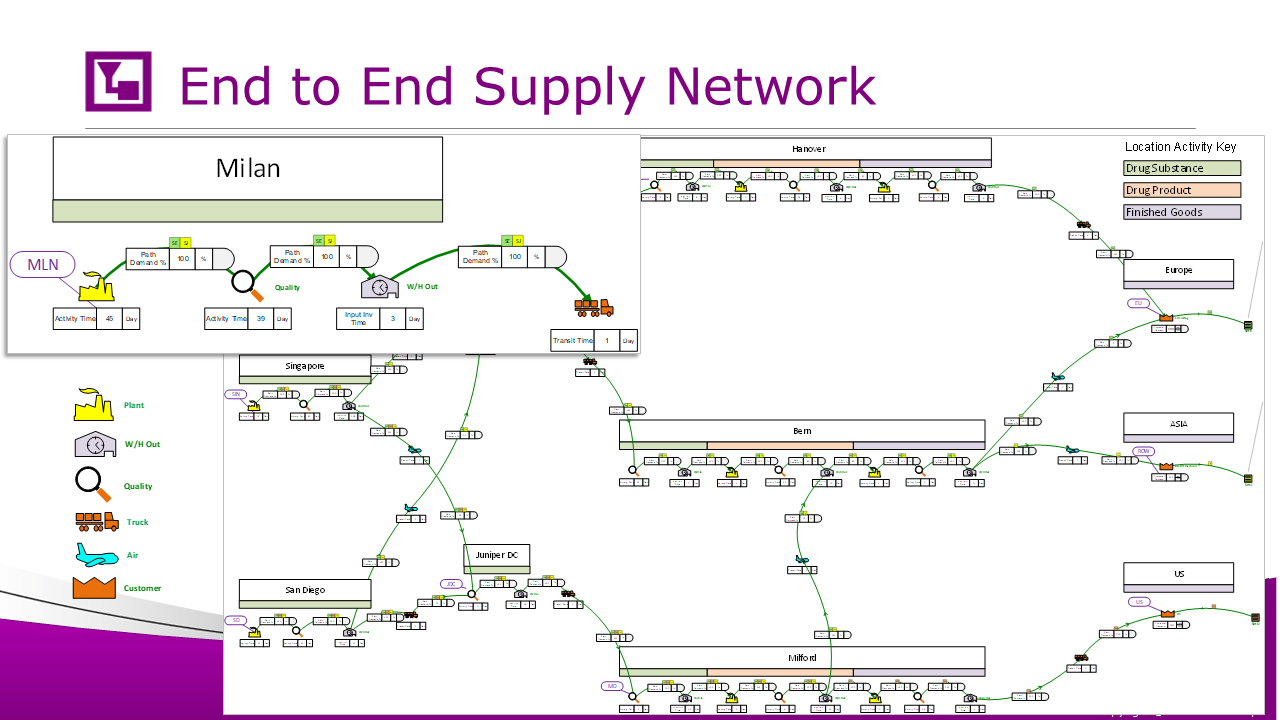
This map shows the supply network for pharmaceutical production—from manufacturing through global distribution. It visualizes capacity across sites and how products move through the network. For instance, it reveals that Milford may not have enough finished goods capacity, requiring some output to be shifted to Bern.
The model factors in flow percentages, shipping methods, and transit times, enabling teams to assess how different routes impact lead time. It also generates lead-time charts comparing alternate delivery paths to Europe, Asia, and the U.S.
The aim is to pinpoint and strengthen preferred supply routes while reducing dependence on slower or riskier ones. A built-in “timer” feature also tracks shelf life along the journey, helping ensure quality and compliance. This type of mapping supports smarter decisions around production planning, capacity management, and logistics strategy.
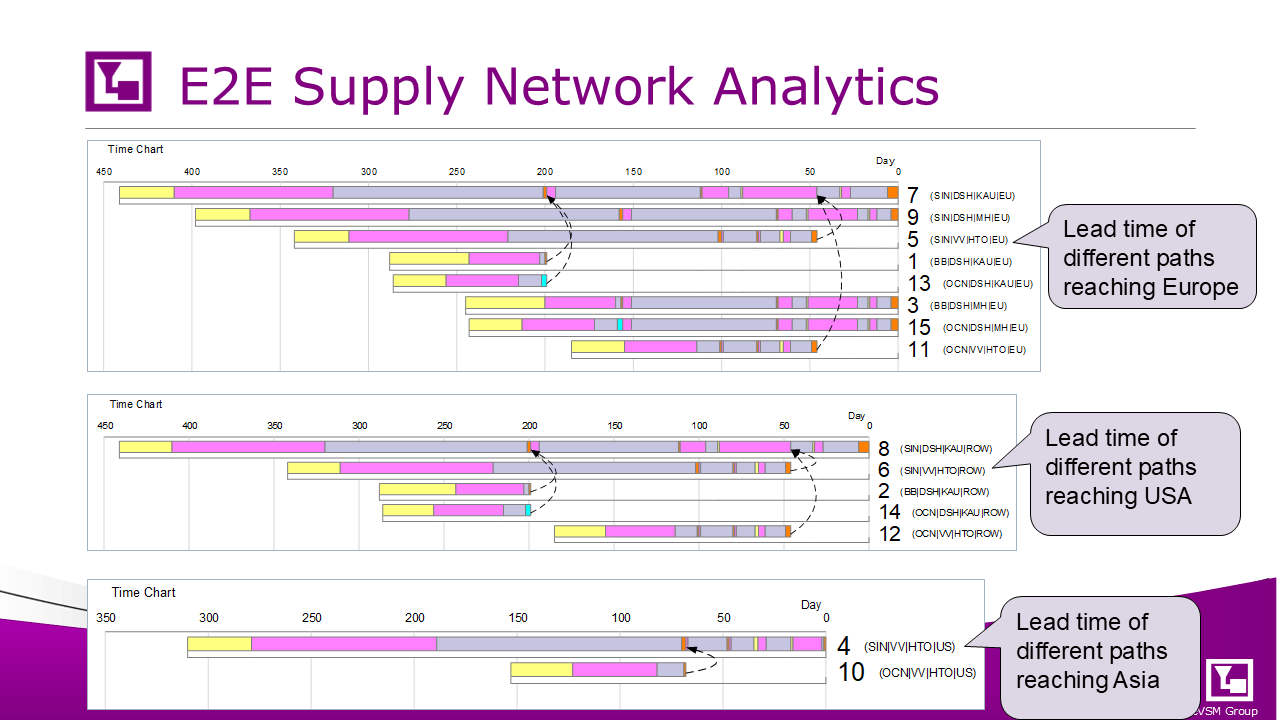
These are the lead time charts associated with the prior map for destinations in Europe, USA and Asia
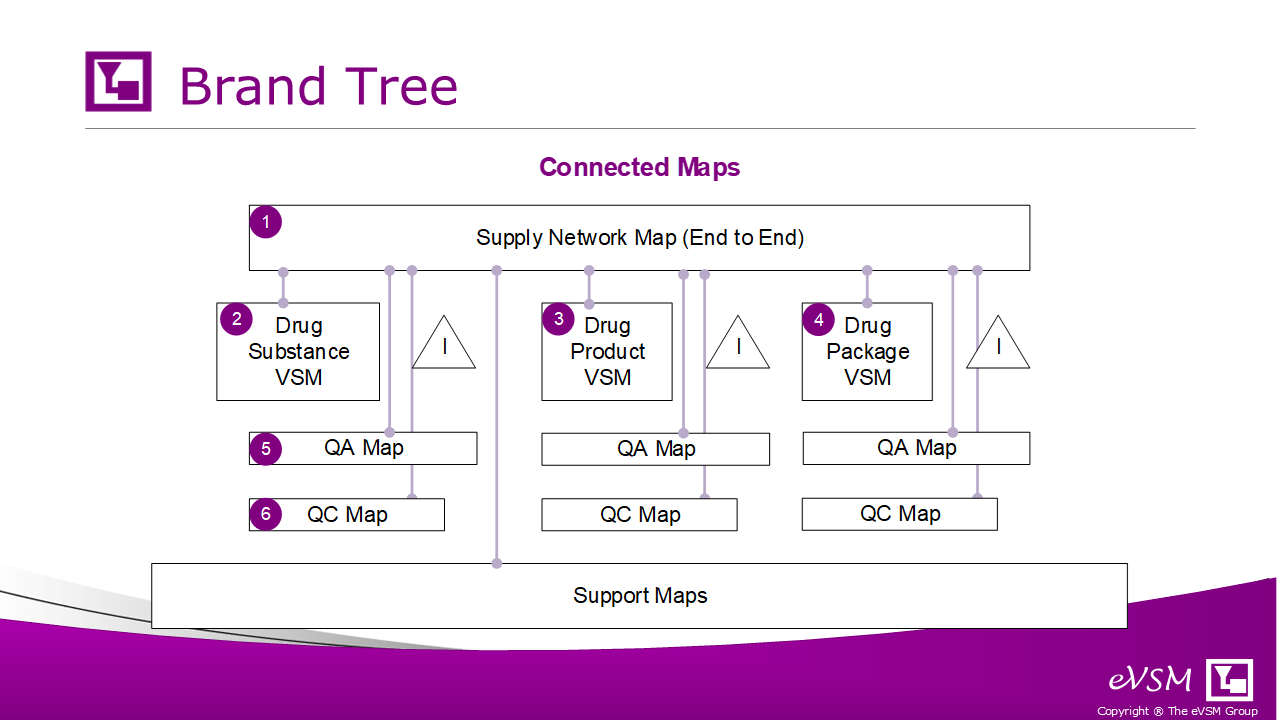
The Brand Tree illustrates how different maps come together to represent the production view of an specific drug brand.
At the top sits the Supply Network Map, offering a full end-to-end view. It highlights key nodes—Drug Substance, Drug Product, and Drug Package—each representing major steps in the pharmaceutical value stream. Running alongside these production streams are QA and QC processes. Bottlenecks—whether due to staffing or equipment—in any of these areas can delay batch release.
The map also accounts for supporting activities such as hiring and equipment certification, which play a critical role in keeping the production timeline on track.
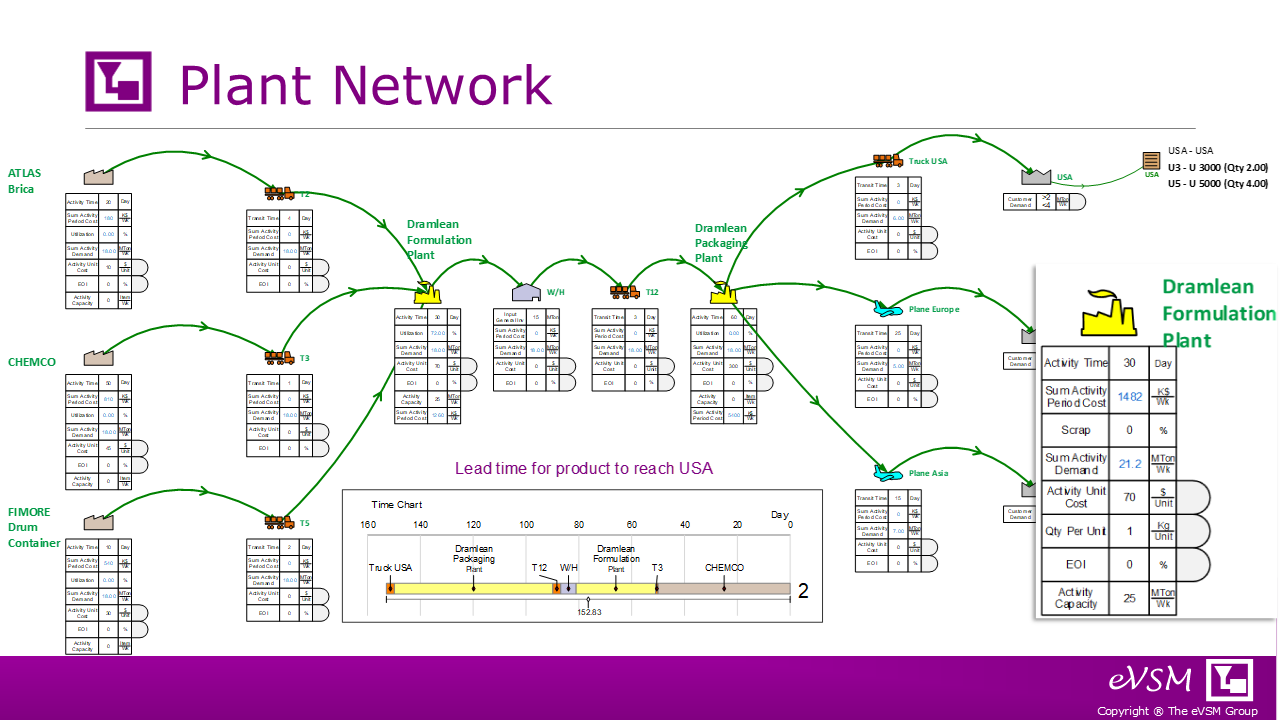
The Plant Network map zooms in on a specific node within the larger supply network—here, focusing on the primary raw materials, outputs and logistics around the Dramlean Formulation Plant. It allows users to input plant capacity, automatically calculating utilization levels.
The map also enables analysis of dual-supplier strategies, helping teams weigh trade-offs in cost, lead time, and risk.
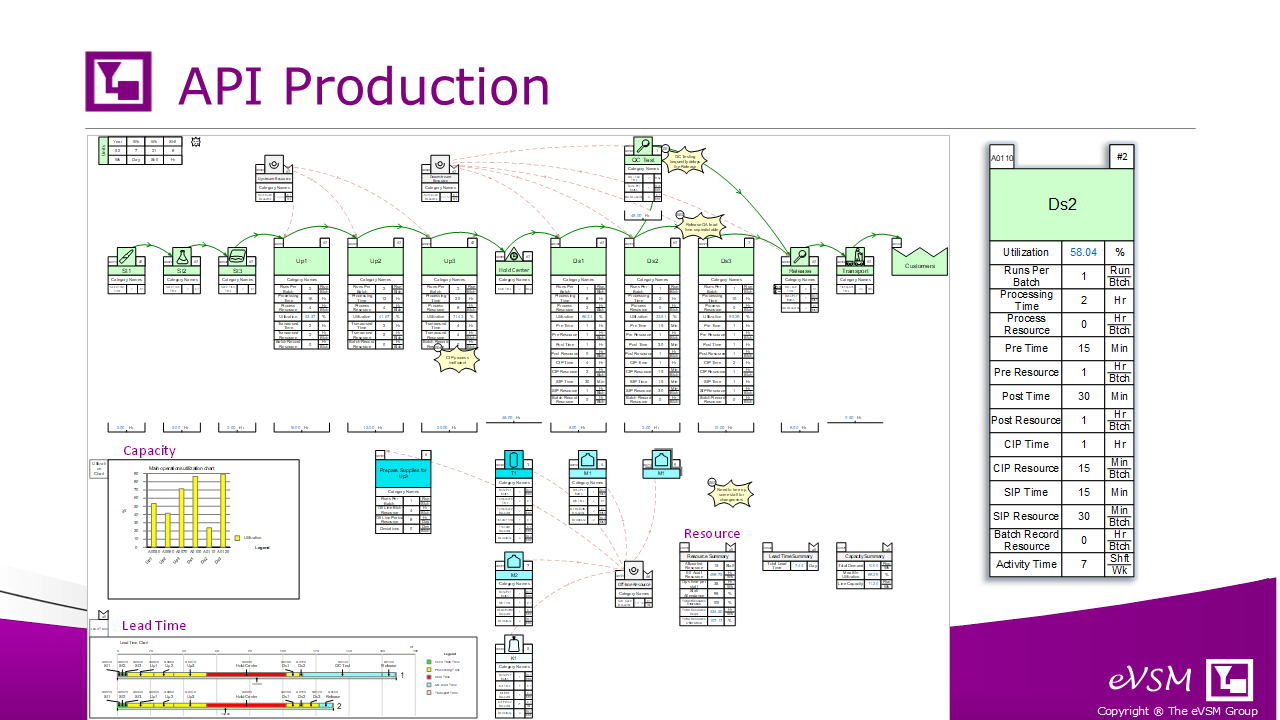
This production map focuses on API (Active Pharmaceutical Ingredient) manufacturing. It outlines each critical process step—capturing not just processing time, but also supporting activities like pre- and post-processing, Clean-in-Place (CIP), and Sterilize-in-Place (SIP) requirements.
Teams can enter resource needs by category or pool (e.g., media prep or in-line operations) and compare calculated Full-Time Equivalent (FTE) requirements with actual staffing levels. This helps improve workforce planning and spot imbalances between workload and available resources.
The eVSM application for API manufacturing was developed in close partnership with a pharma client, incorporating feedback and refinements based on usage with actual production value streams.
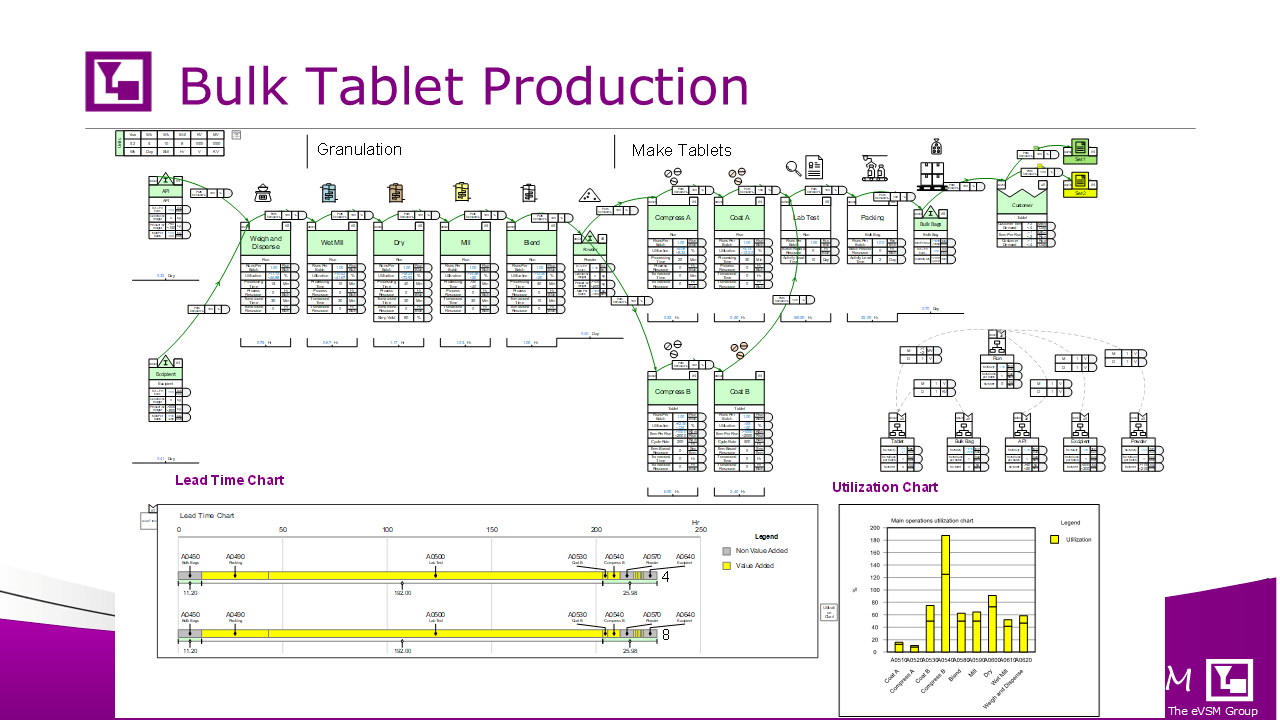
This map details the end-to-end process for manufacturing bulk tablets—including a mix of two tablet sizes—covering steps from granulation through compression, coating, testing, and packing. A key usability feature is the ability to manage unit conversions and connect them to demand flows in the value stream, using a conversions tree located just above the utilization chart.
Each process step includes built-in calculations for demand, processing time, and resource usage. The utilization chart highlights potential bottlenecks or underutilized resources, helping teams identify where adjustments may be needed.
We have built a library of simple pharmaceutical icons to help see the process steps and will continue to extend and deliver that with the software. You can see some of the these above the process steps
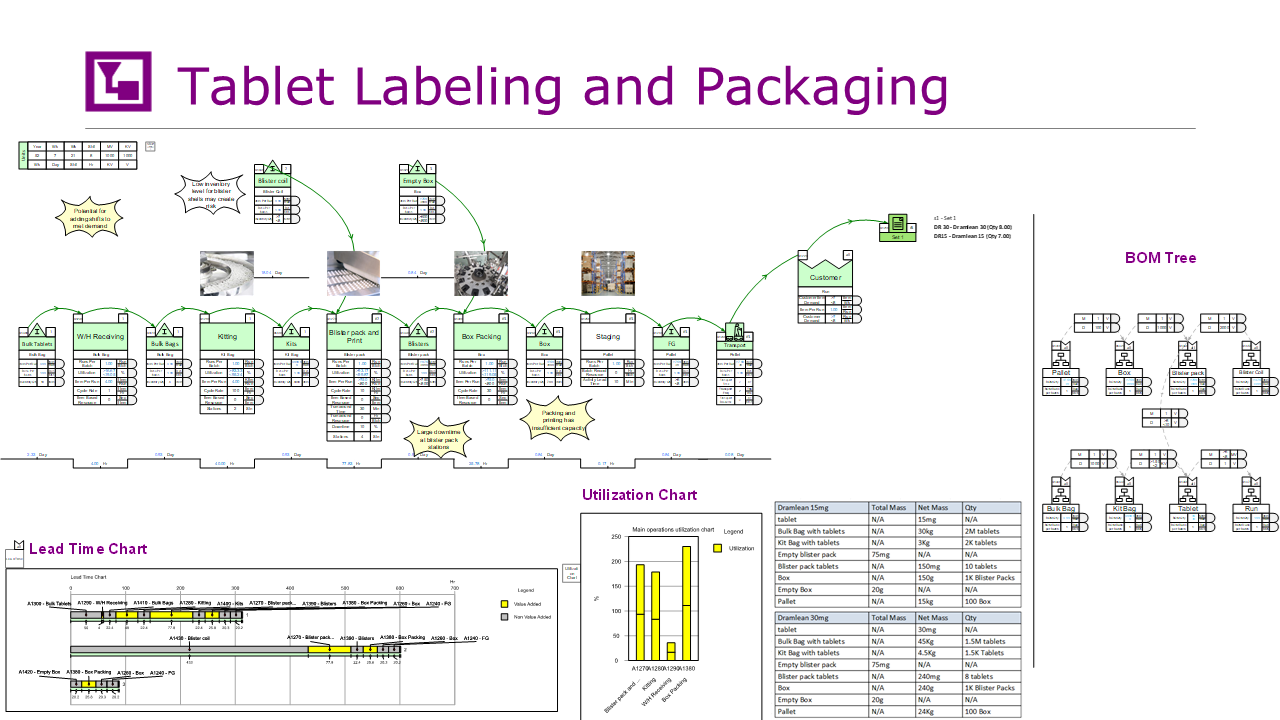
This map captures the entire tablet labeling and packaging process—from bulk tablets and kitting to blister packing, boxing, staging, and final shipment to the customer.
A tree structure on the right visualizes the relationships among production items like tablets, blister packs, boxes, and pallets. Keywords connect these conversion values directly to the corresponding steps in the process. By combining a process view (value stream) with a product view (tree structure), the mixed model approach makes it easier to both build and interpret the map, enhancing clarity and team alignment.
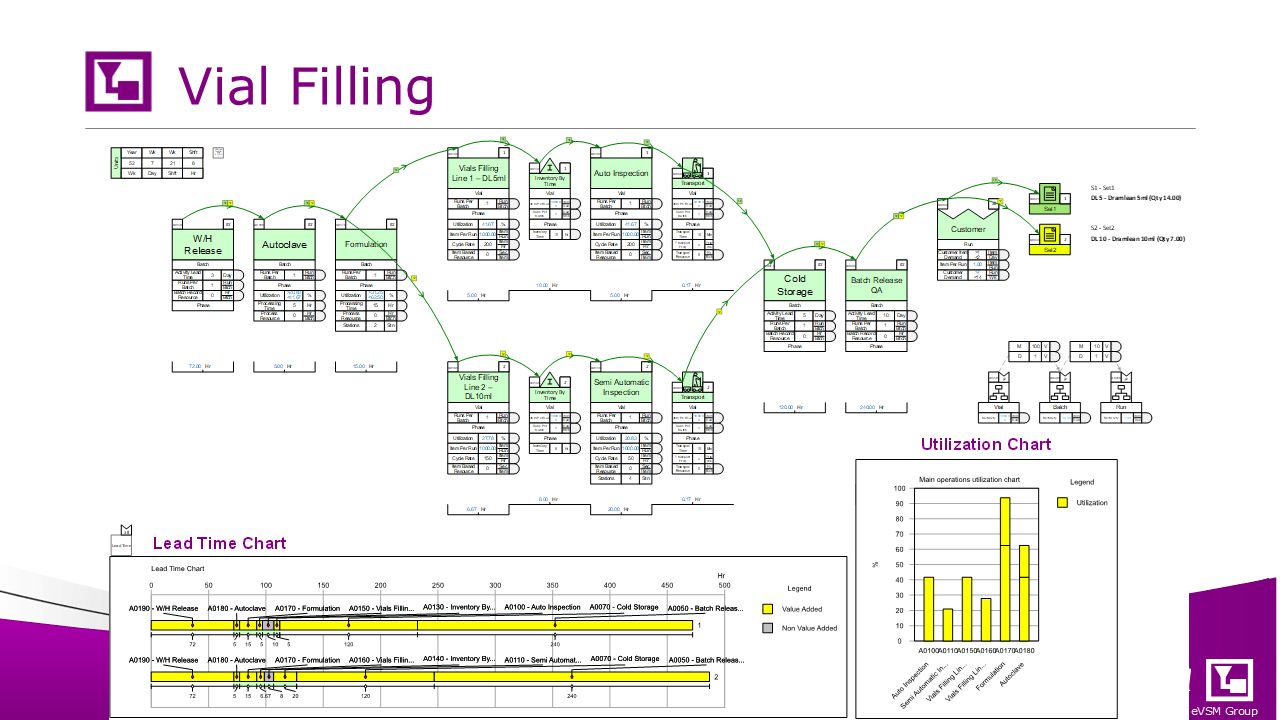
This map illustrates the vial filling process, accommodating multiple vial types and dosage levels. It features two production lines—one with automated inspection and the other with semi-automatic—mirroring common configurations in pharmaceutical manufacturing.
The flow covers every key step, from warehouse release and autoclaving to formulation, filling, inspection, and QA release. A lead time chart shows where value is added and where delays occur, while the utilization chart reveals the capacity of each station and its ability to fulfill the demand. The visuals support decision making on equipment and staffing levels.
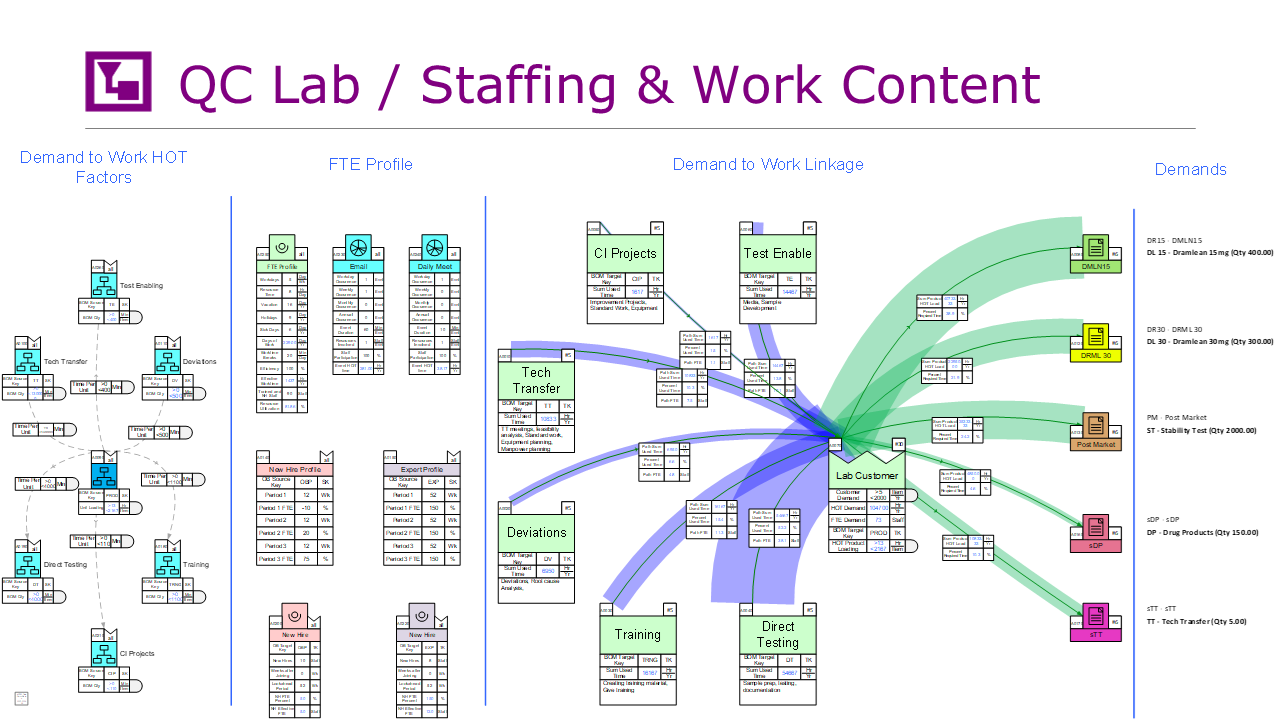
This map provides a comprehensive view of quality control (QC) lab demand, staffing, and task allocation. It links product-specific testing—such as for Dramlean 15 mg and 30 mg—to the associated workload across lab functions like direct testing, deviations, tech transfer, and training.
Line thickness in the map reflects hands-on time (HOT): green lines show the HOT required to meet demand, while blue lines indicate where that work is performed in the lab.
By tying demand drivers to actual effort, the map helps teams forecast staffing needs, schedule both urgent and flexible tasks, and plan training effectively.
With detailed FTE profiles, work type breakdowns, and a clear visual link between workload and resource use, the map supports data-driven lab management. Staffing levels can be adjusted based on the lab’s priorities—whether that’s maximizing efficiency or meeting guaranteed turnaround times.
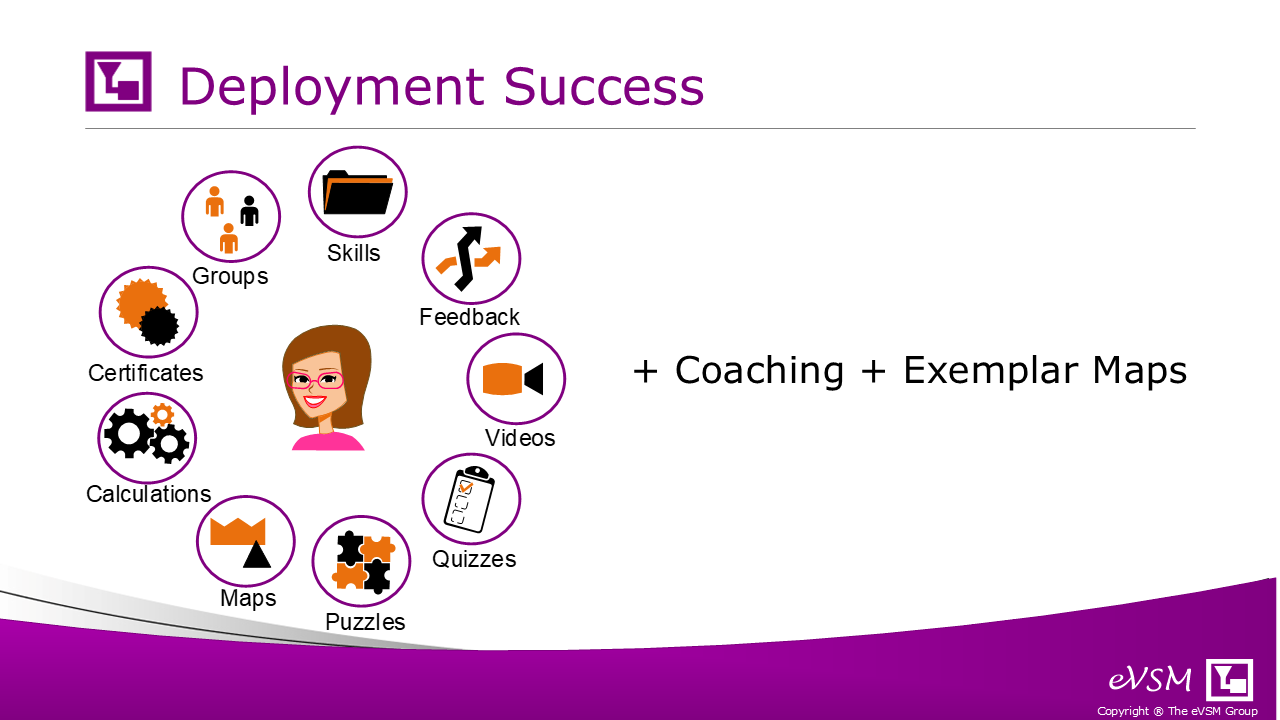
Successfully implementing lean and digital value stream mapping (VSM) in pharma goes beyond just having the right tools—it’s about empowering your teams. The eVSM approach includes a comprehensive learning and deployment ecosystem: skills training, videos, quizzes, interactive puzzles, coaching, and access to exemplar maps that guide users from concept through execution.
The goal is to generate smarter improvement ideas and deliver breakthrough results in applying lean principles across the pharmaceutical landscape. Our progress has been driven by close collaboration with Pharma clients, who’ve helped shape a solution that reflects real-world needs. The result is a robust, field-tested platform that’s ready for production use.