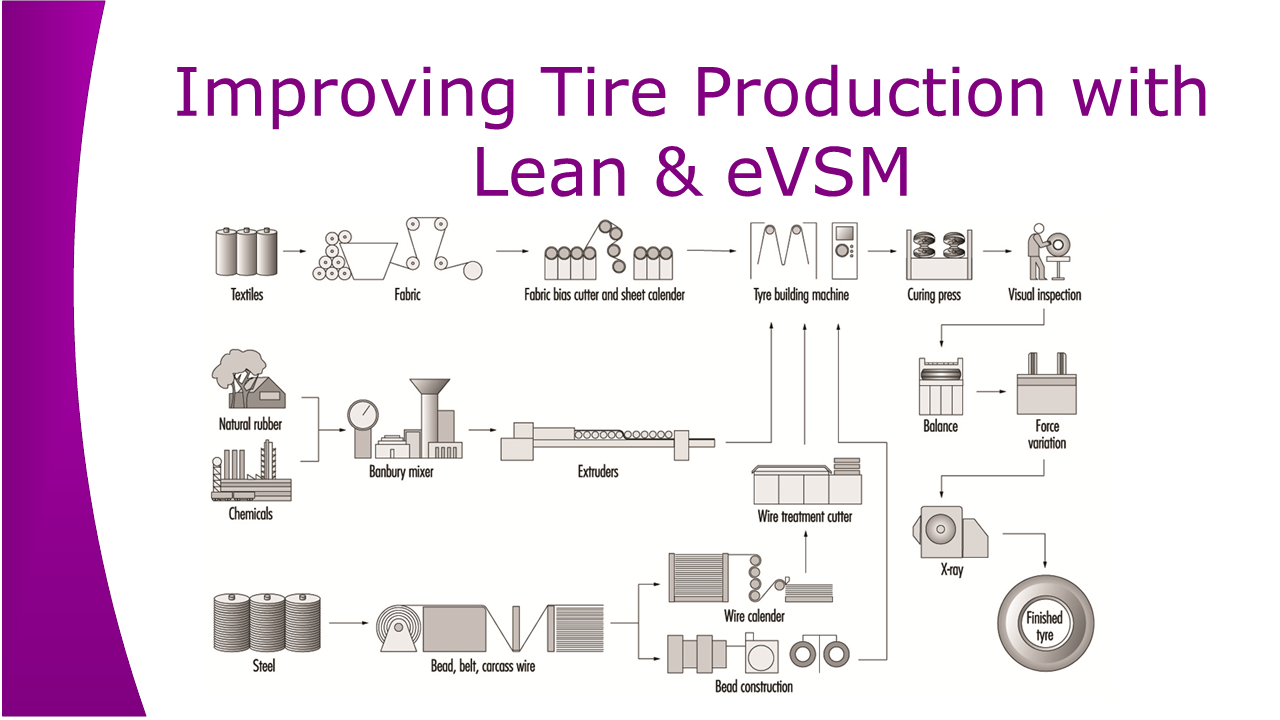
The tire industry (or tire outside the US) is highly competitive. Continuous improvement efforts are underway at all tire manufacturers to reduce production costs. Lean is a common improvement methodology but its starting point, the development of a production value stream map can be very challenging because:
- Production lines make many different tires
- Tires can have different routings
- Tires have different cycle times through shared resources
- Tires will have differing demands
In working with several prominent tire manufacturers, we have extended eVSM and established an easy way to value stream map in this challenging environment. Let's illustrate with a simple case study.
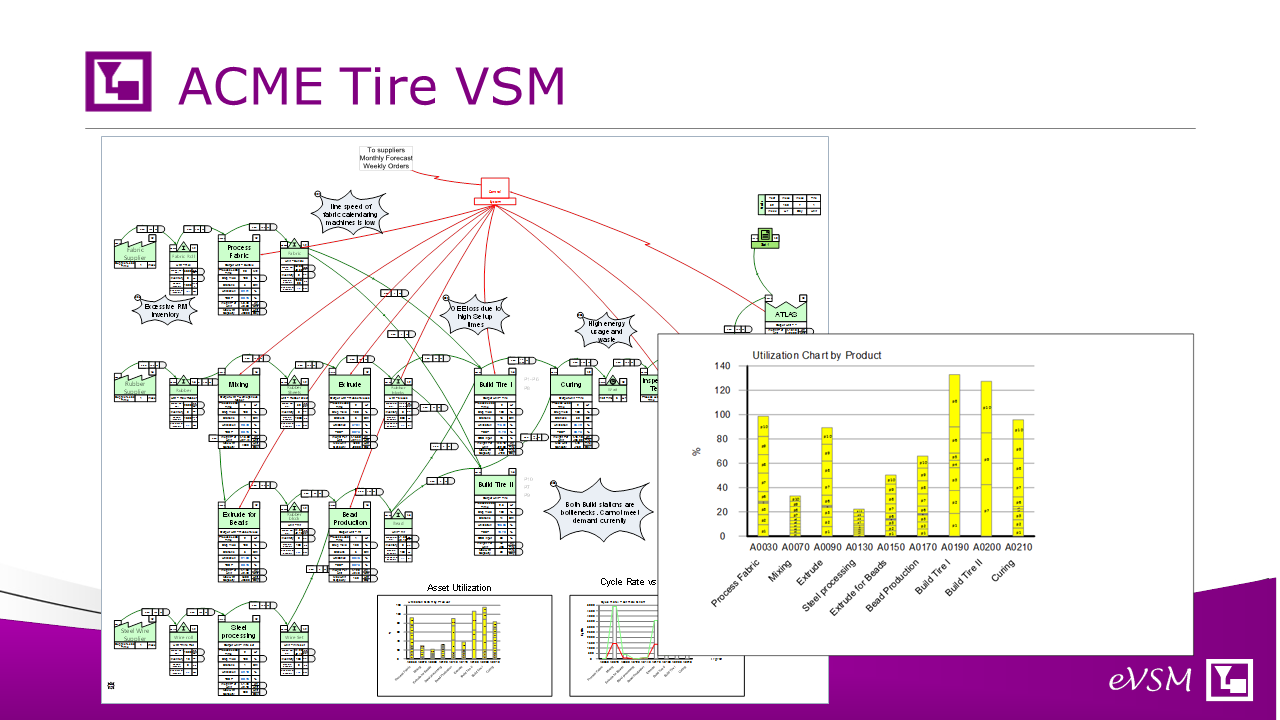
Here’s a tire VSM for an ACME production plant. It shows information flow, material flow, and asset utilization by tire type. It calculates the lean analytics to help visualize the waste and develop improvement ideas. The single master map can handle different tire demands, different routings, and different operational values. The map can be used for capacity, lead time, cost, and resource analysis. Let's see how it was developed...
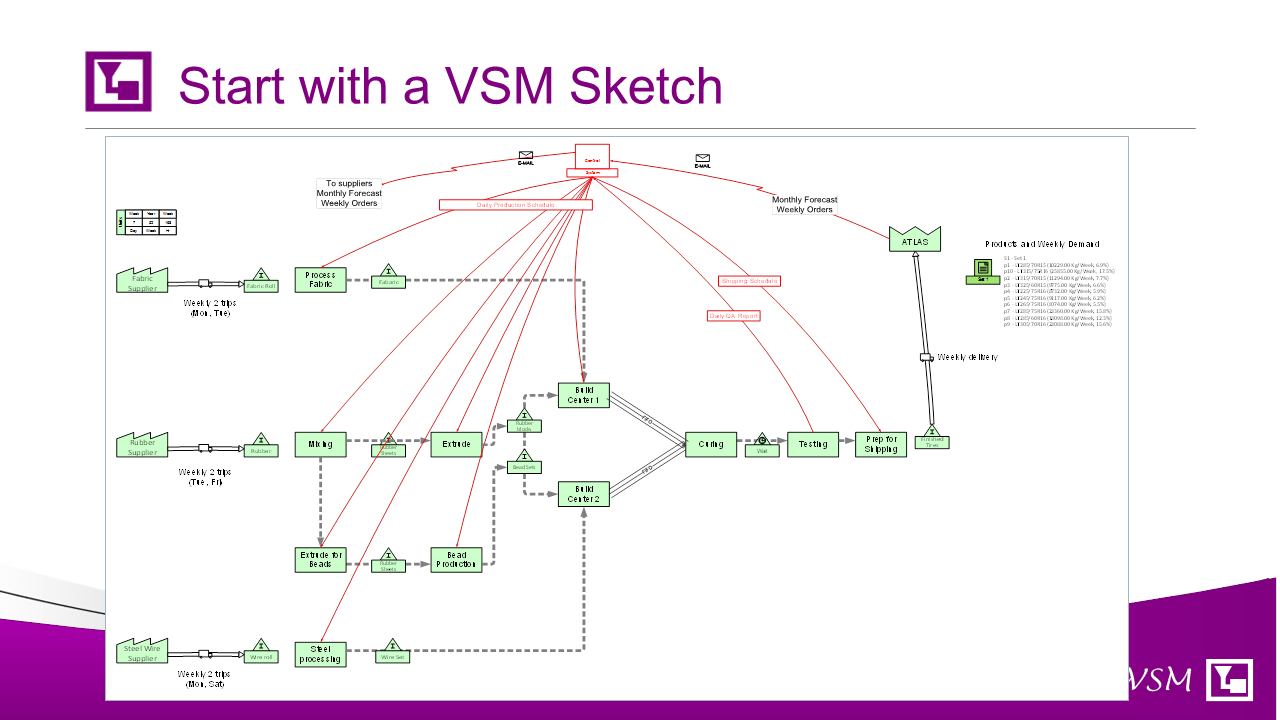
The material and information flow is captured with paper and pencil (or on a wall) by the team. Then converted into a flow chart in eVSM as shown here. All the VSM icons are available and can be used in a drag and drop fashion.
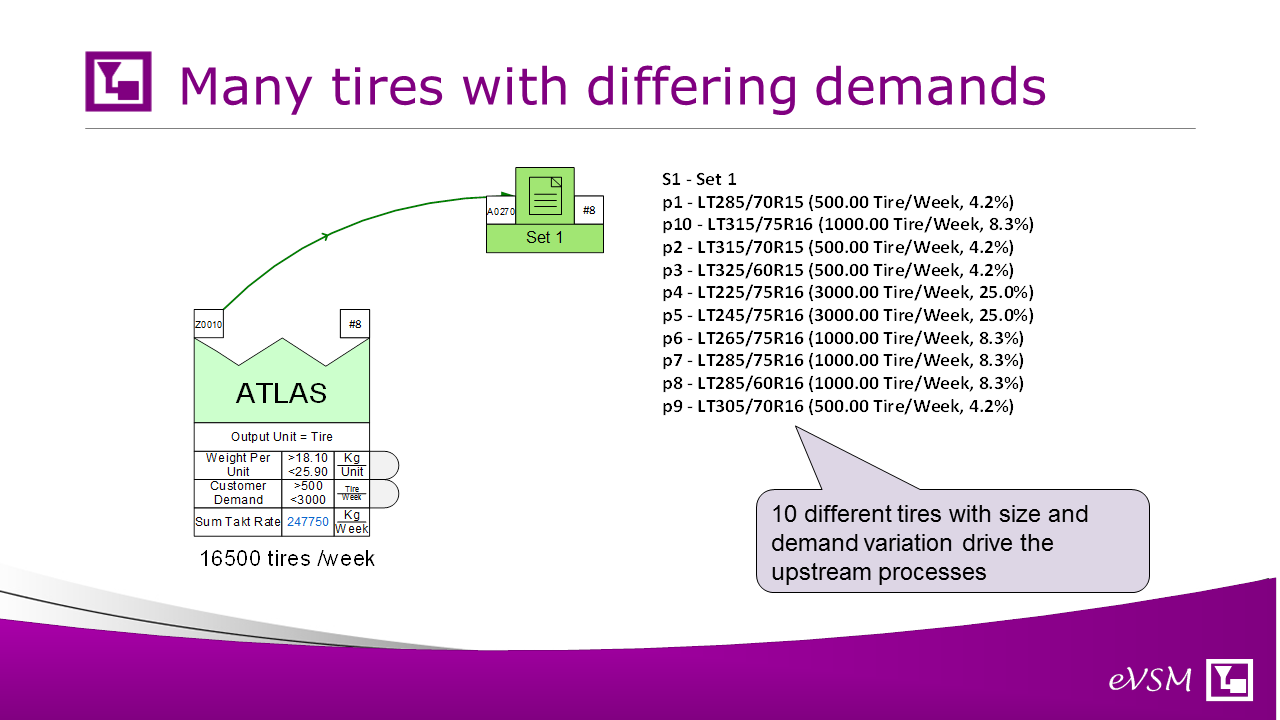
We can “turn on” the demand variable at the customer and are able to tell the map which tires are made and the demand for each. Data can be typed onto the map or input via a spreadsheet. We just have 10 tires in our example. In practice there are often many more.
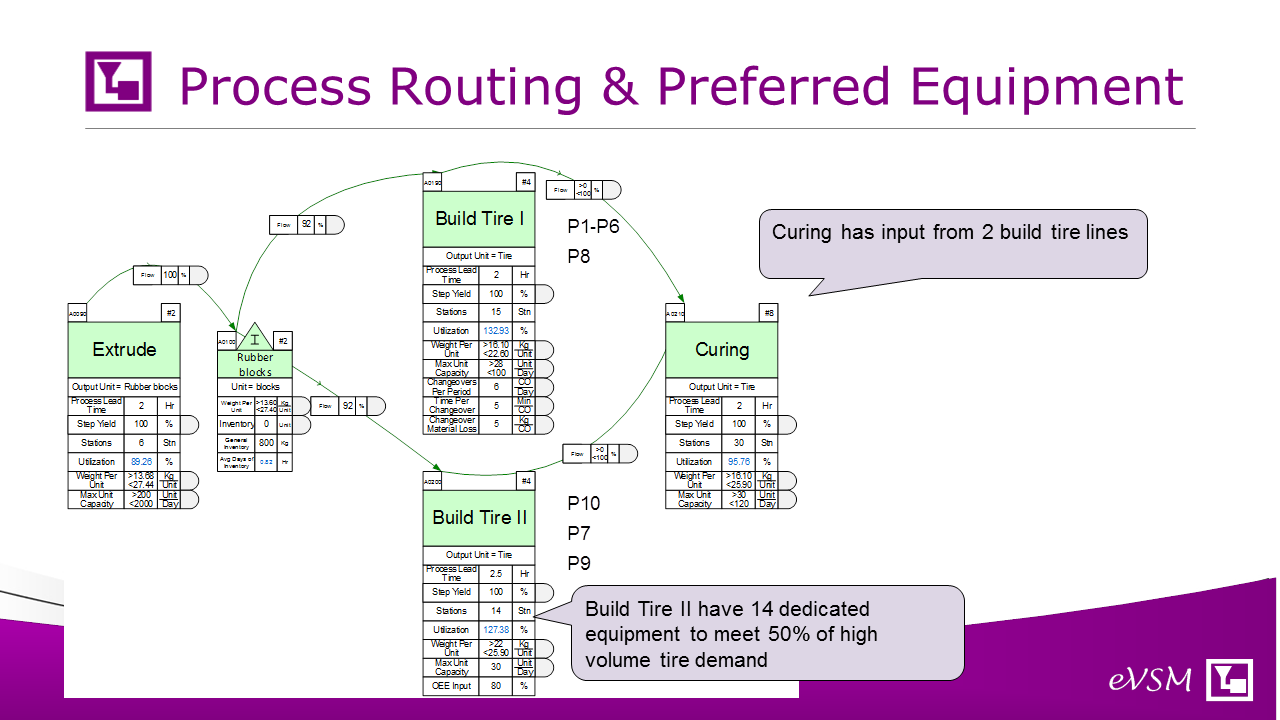
The map has the capability to handle multiple process routings. In this example tires 7 tires use the “Build Tire 1” station and the other three use “Build Tire 2”. We can also map the situation where a majority of the demand for a tire goes through one station but a small percent goes through an alternate. This is often the case in reality.
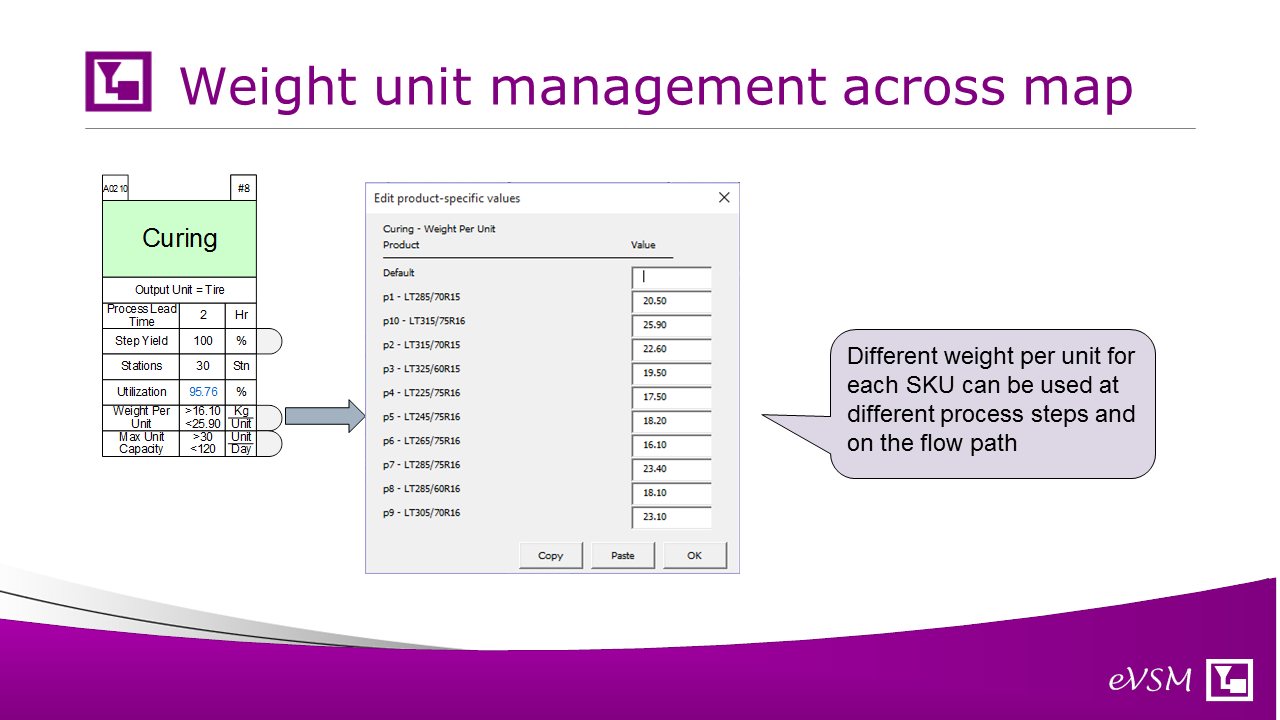
Where multiple tire types are going through a shared resource like “Curing” we can specify different operational values (like cycle rates) for each tire.
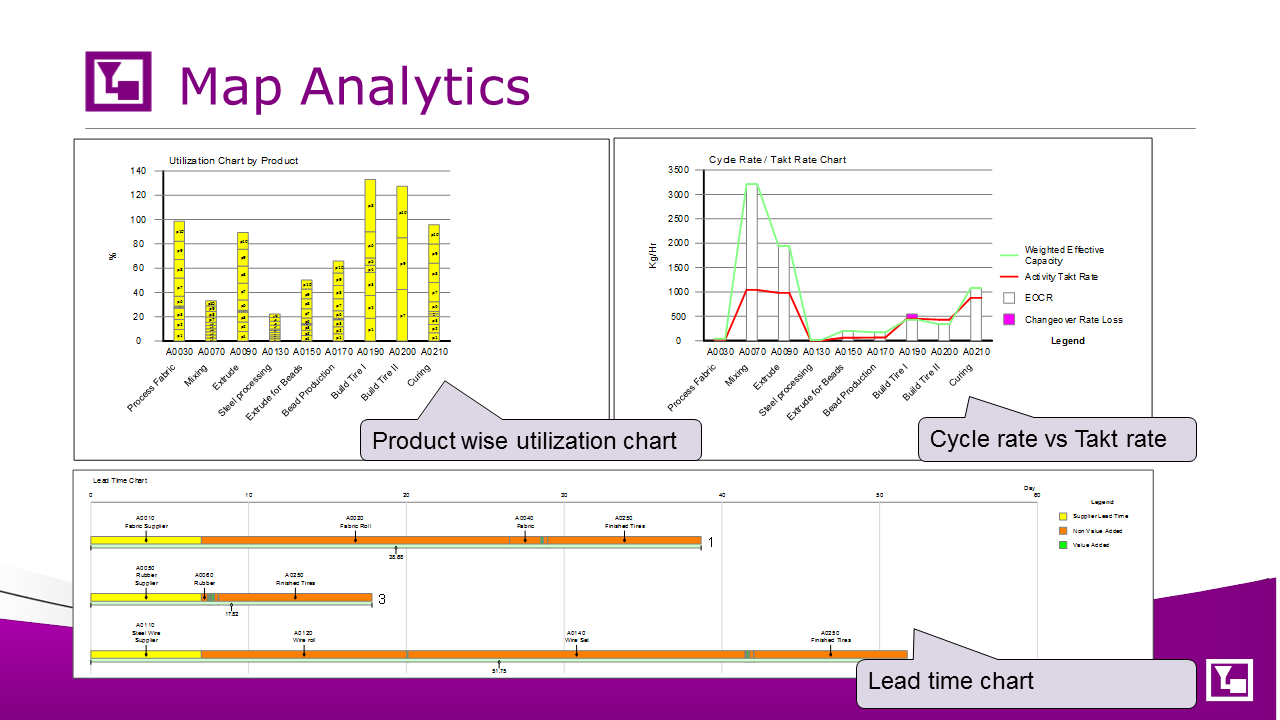
eVSM has built in analytics for metrics like days of inventory, lead time, capacity, OEE and cost. These metrics can be visualized via automated charts.
You can see the important extensions included in eVSM to make the development and analysis of tire value stream maps feasible and simpler. eVSM has much more to offer than just the mapping however. It provides tools to support the full continuous improvement cycle including future state design and project planning. Request a web conference via support@evsm.com and discuss the benefits with one of our experts.