The Talent acquisition (or recruiting) value stream is crucial to organizations and needs to fill in vacancies with qualified staff in an efficient and timely way. This blog develops a generic map for a recruiting value stream complete with analytics for key metrics like "Time to Hire". It can be downloaded and adapted to a companies actual recruiting process using the eVSM software.
The eVSM group has collaborated with one of our partners (ITCube) to develop a simple analytical value stream model that can be adapted to any company to help them improve time to hire, resource utilization, and cost metrics for the value stream. Below we review the model and discuss how it can be used as a starting point and modified to fit a company's recruitment process.
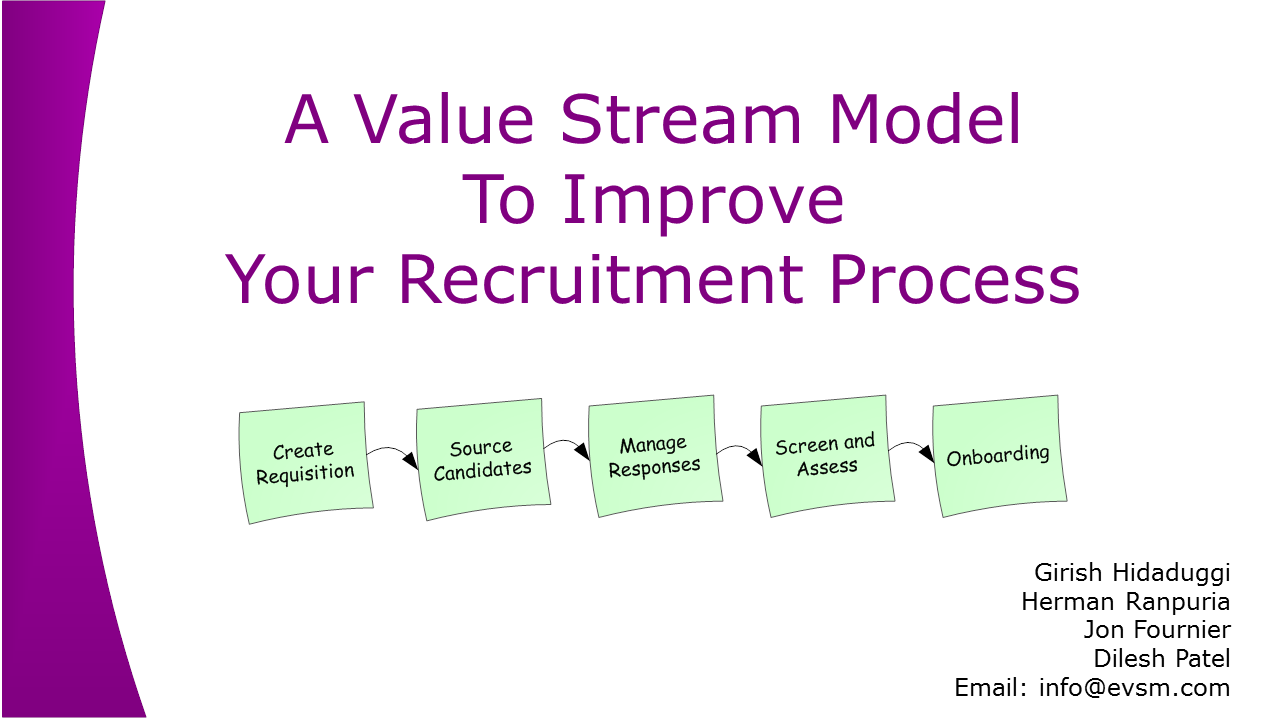
The sketch above illustrates the basic steps in the process. We need to expand these to show the decision points and iterations that impact the “time to hire”
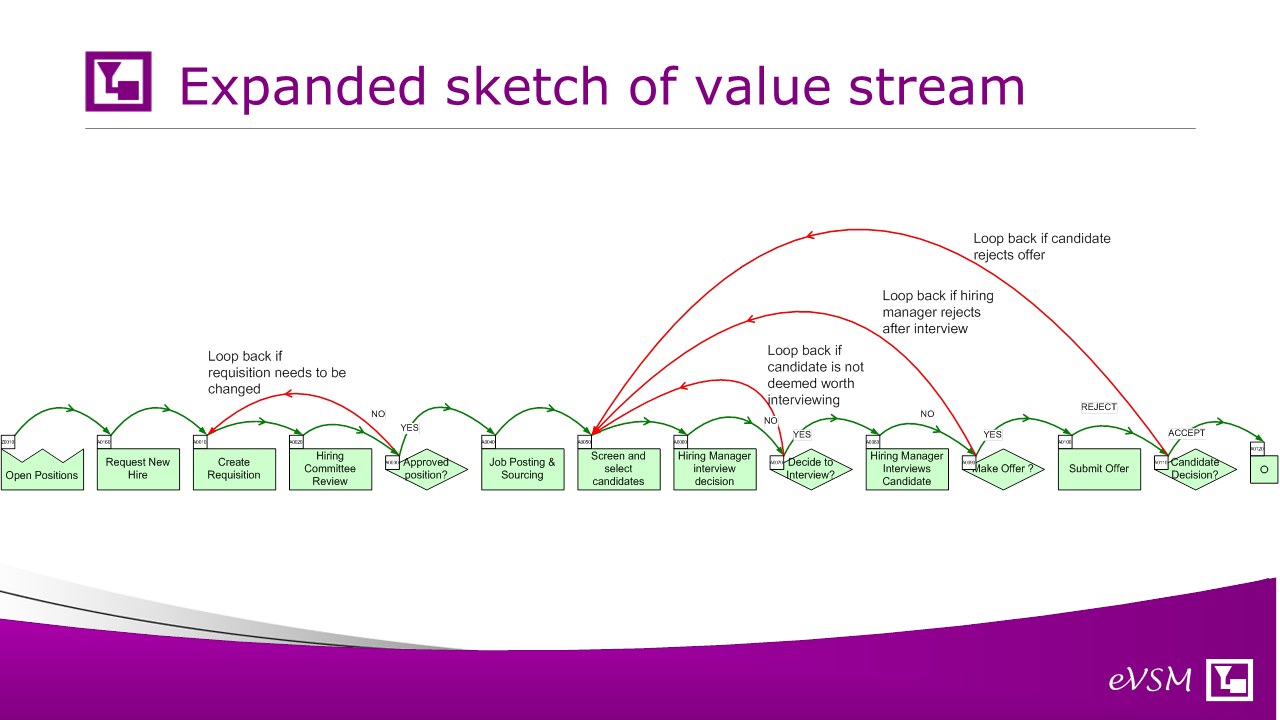
Here is an expansion of the flow. The red arrows show the loopbacks in the process from various decision points. The first on the left occurs is there is any deficiency in the hire requisition. The next three are related to moving to the next candidate if the current one is not worth interviewing, if the interview itself is disappointing, or if the candidate rejects the final offer. If we can now add data to the map we can turn it into an analytical model that gives us estimates for time, resource, and cost. Let's review the input data variables.
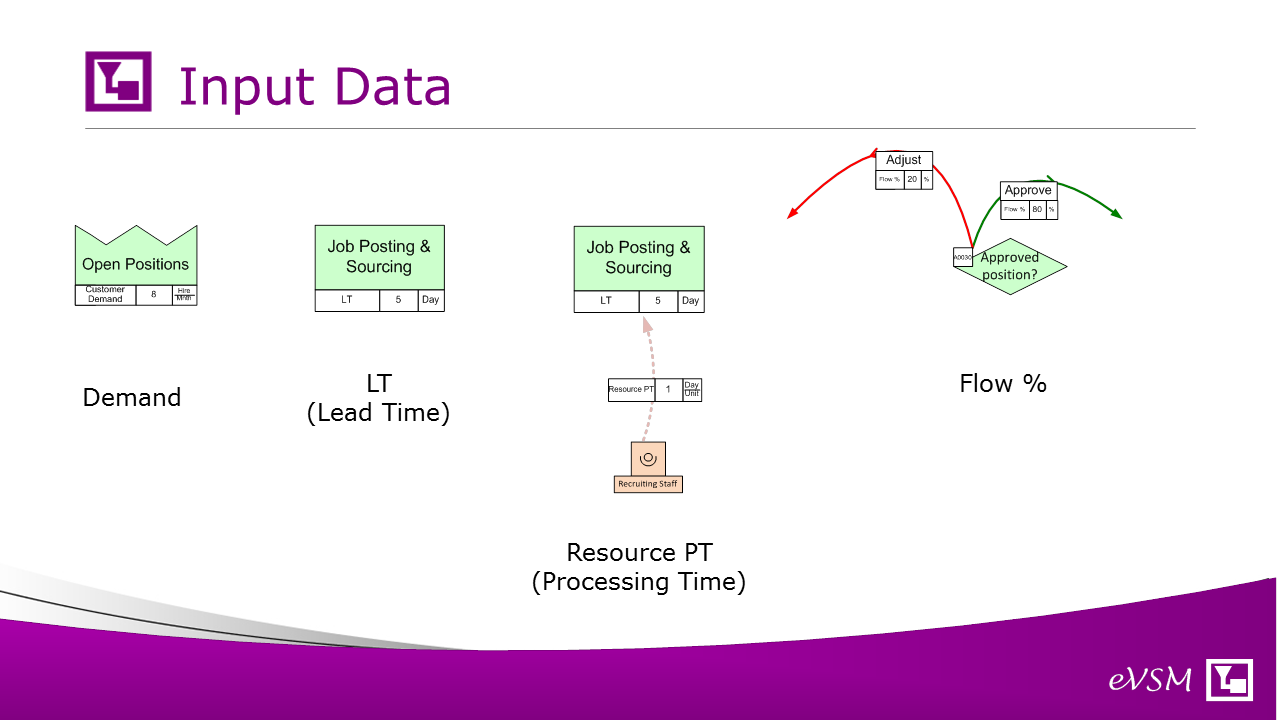
There are 4 data inputs we need to provide:
1. Demand: How many open positions per time period are we trying to fill with this value stream
2. LT (Lead Time): At each activity what is the lead time? In the example, job posting and sourcing deliver results in a LT of 5 days
3. Resource PT (Resource Processing Time): We can assign different resources to support an activity and specify how much of that resource time is needed. In the example, 1 day of the recruiting staff’s time is needed in support of the job posting and sourcing for each open position
4. Flow % : At each decision point, we input the flow % of decision outcomes. In the example, a requisition is currently required to be adjusted 20% of the time.
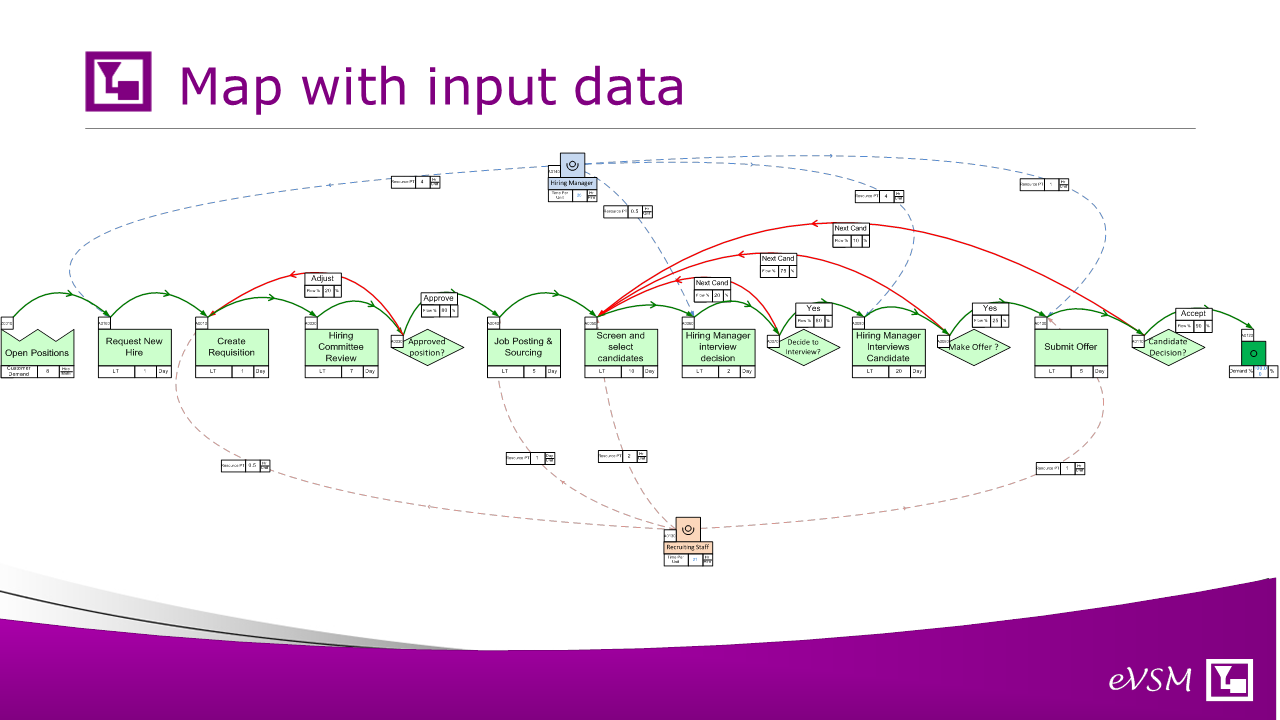
Here’s the map with those 4 types of input data added. Note how the key resources (recruiter and hiring manager) are 'piped' into the activities they support. We can now “solve” the map using the built-in equations to calculate the overall metrics of time to hire, resource utilization, and cost. Let's look at these metrics one by one..
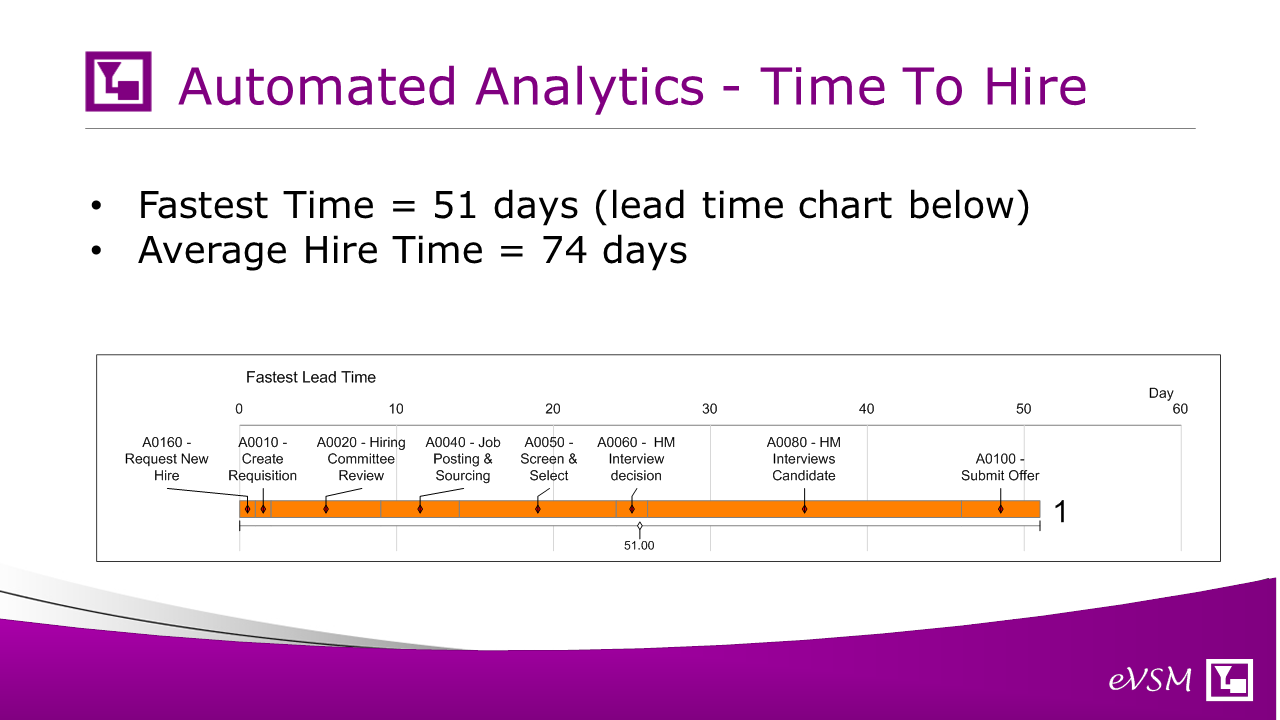
For our sample data, the model calculates the fastest ‘time to hire’ as 51 days, with the average being 74 days. For any specific route, we can plot the lead time chart. The one above corresponds to the fastest route achieved in 14% of the hires.
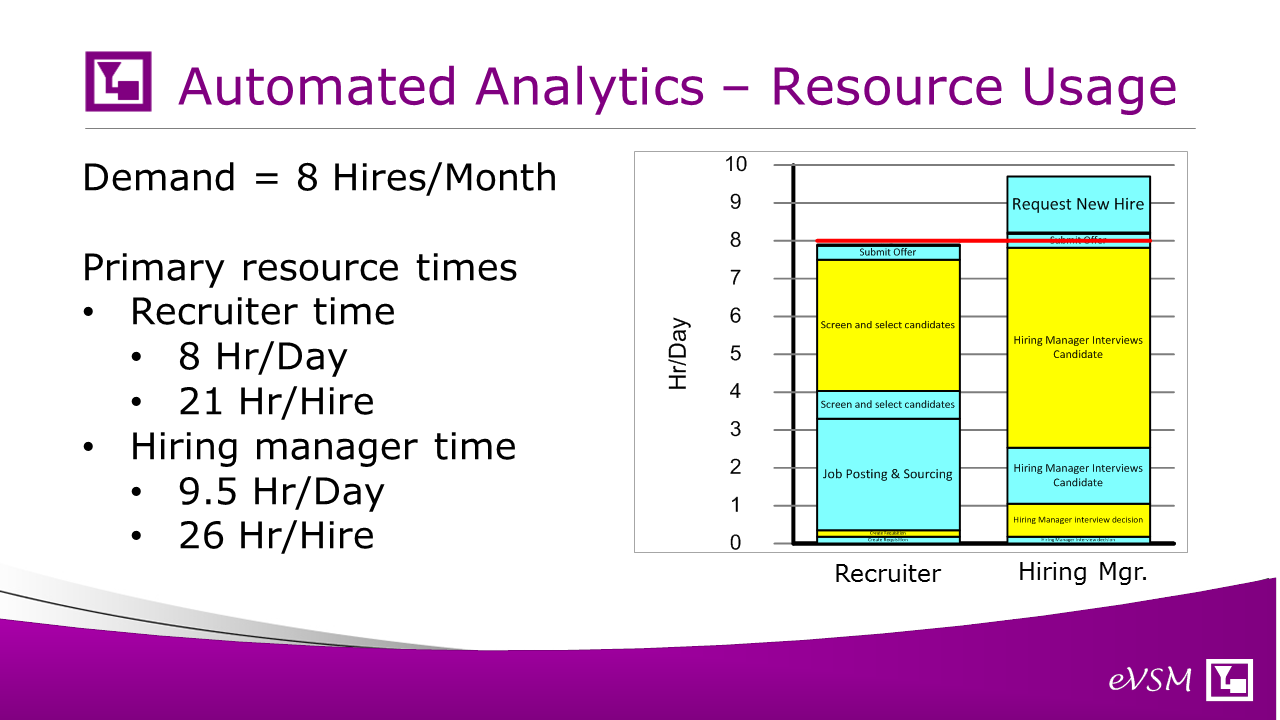
The map calculates the utilization of the two key resource roles in the model (recruiting staff and hiring manager) and calculates time needed on a per-day basis (corresponding to 8 hires per month) or on a per-hire basis. The resource utilization chart shows the relative effort on different activities.
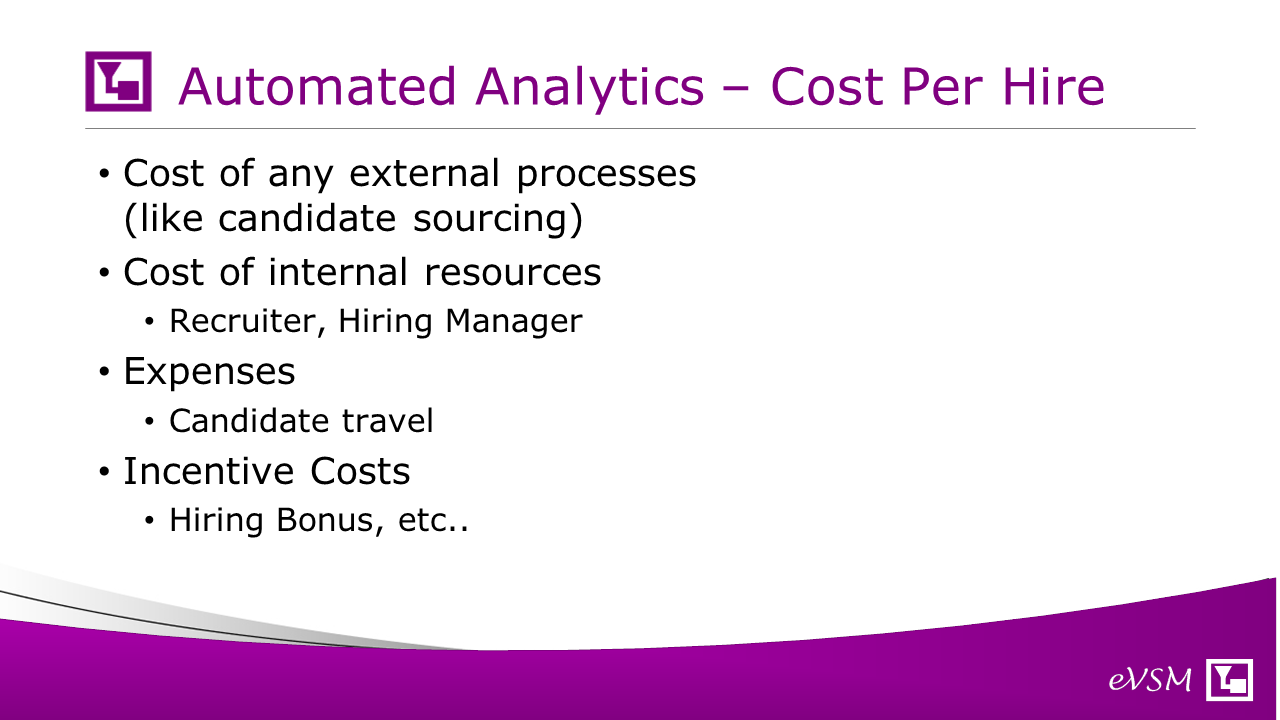
The map can take cost data input for resources and activities and so calculate the cost per hire and cost per day metrics for the value stream
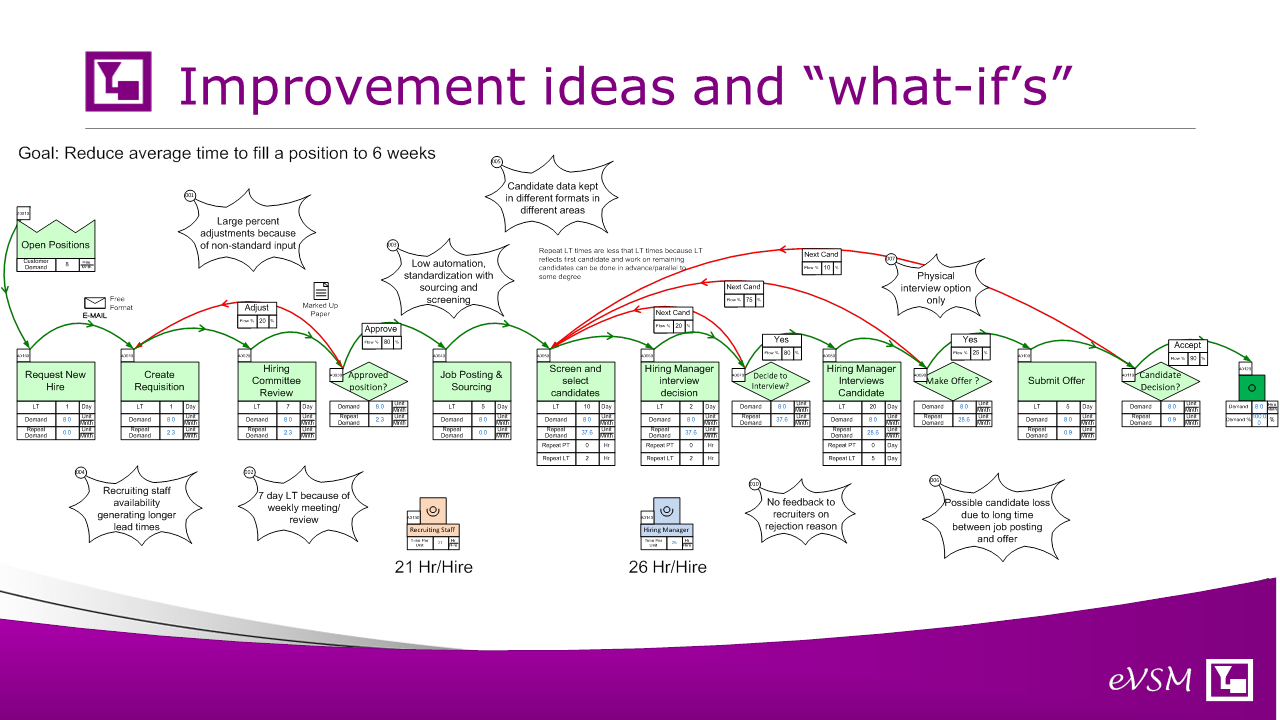
The value stream model allows us to do ‘what-ifs’ and see their impact on these 3 key metrics. The model allows improvement ideas to be posted and managed directly on the map with properties like owner, priority, difficulty of implementation, time, etc.
If talent acquisition is a critical value stream for your organization, this generic value stream model provides a great short cut to a working value stream model specific to your company that can help you improve the key metrics of time to hire, resource usage and cost per hire . The model is easy to acquire, easy to edit, and has associated available expert help. Contact us via Email: info@evsm.com