Some of our users have evaluated us by simple looking at who else uses the eVSM software. See some of our clients at evsm.com/clients. We have not lost a VSM benchmark for a decade now.
For a hands-on approach to evaluation, you could use the most familiar case study on VSM in the world today. Many of you will have come across the book "Learning To See" (Rother & Shook) published a couple of decades ago and a fantastic intro to the value stream mapping process and its fit within the lean methodology. Millions have benefited from this, ourselves included.
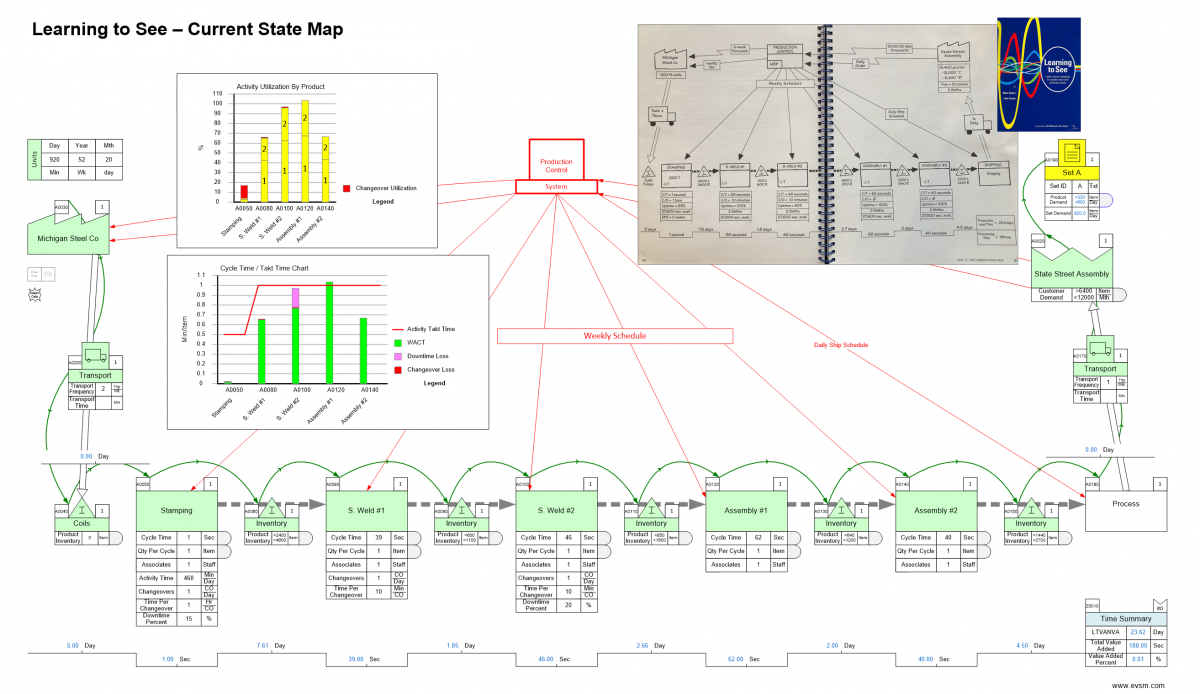
A fun way to evaluate Mix Mfg (or any other approach) is to see how fast you can capture the current state map from the ACME case study in the book and do the related analytics and visuals. The map is simple and just has two parts (left and right) in the mixed model line. We also strongly recommend that you buy “Learning To See” if its not already on your bookshelf. We tried capturing the case study current state map using the data in the book and found the following:
- The capture and analytics (lead time, capacity) took 12 mins total. We took a picture of the map in the book and just sketched over it in Mix Mfg.
- Lead time results (VA, NVA) compare exactly with those reported in the book. See attached graphic.
- The utilization and CT/TT charts pinpoint line balance issues, losses and bottlenecks immediately.
- Note that the utilization chart shows asset utilization by product. It’s a favorite feature.
Creating this same map with the charts can easily take hours and imagine if you have to make changes to reflect real world aspects. Perhaps both products don’t have the same routing ? Perhaps they have different cycle times at an activity ?. Here are the two items that we consider “must-haves” for plant mapping software
- Must allow direct input of multiple products with different demands, different cycle times and different routings through shared resources
- Must automatically calculate and plot lead time, capacity and resource balance charts
Also, no software is useful unless you can learn it and there is good technical support. We include a complete learning management system in the software license fee so you can deploy it anywhere/anytime. Support from us is via email to support@evsm.com. The support line is manned by VSM experts and is also included in the license fee.
If you wish, request a live evaluation web conference with us where you can play with the map above on one of our servers without needing to install anything. We can also provide the map to you in eVSM format if you are trying the software on your own computers.