Value stream mapping is a process that should be done as a team. You can't get a realistic sense of how a value stream works without involving the people who work in that value stream. The de-facto standard way of making value stream maps is by having a group of people work together to form a consensus on how things actually work, and make that into a map.
So once your team have come up with a value stream map (on post-it notes, whiteboard, butcher paper, wherever..) it typically helps to store your map electronically. The simplest reason is to make the map available and easier to find than if it remains strictly on paper.
The eVSM software provides an efficient way to convert a picture of the wall into an electronic map. If your wall map is simple enough to capture in a single clear photo (you should be able to read all text), you can import the image into eVSM with the steps below. If the map is complex and requires multiple images, it's pretty much the same process, but requires you to manually import and align your images in Visio. But then the drawing part is the same.
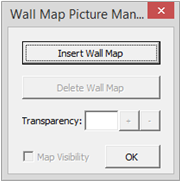
Step 1: Click the Wall Map button in the eVSM toolbar: 
Step 2: Click the Insert Wall Map button to browse for your wall map picture on your computer.
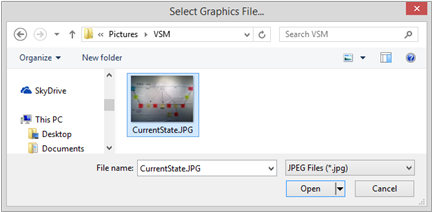
Step 3: Select the picture and click Open
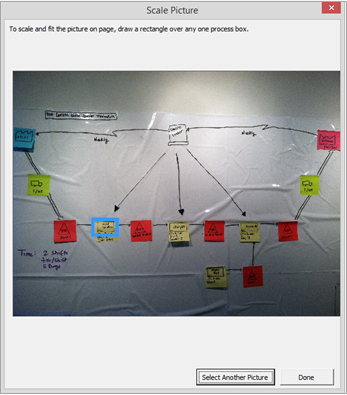
Step 4 : Scale the picture by drawing a rectangle over any one process box. This tells eVSM about how big a process box is on your wall map, so that later, when you drop a process box over the graphic they'll be about the right size.
Click the Done button when you're finished drawing the rectangle.
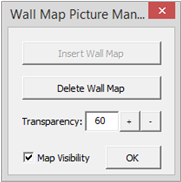
Step 5: Next, a dialog will appear allowing you to change the transparency of the picture, make it visible/invisible on the page, or delete the picture. Click OK to close out once you have the transparency set how you like it. If you need to get back to this form, click the Wall Map button in the toolbar again. (Newer versions have a "Locked" checkbox you can turn off that will allow you to move or resize the image shape on the page so you can get the scaling just right).
Now the background of your page will be the picture you imported. Your next step is to draw an eVSM map over the picture, using the picture to help you position the different blocks approximately to match the wall map.
Most of our Quick Stencils have an accompanying Sketch stencil, which has just the process blocks with no data. We find it's easier to draw the "structure" of the map first with the Sketch stencil, then add the data blocks after and fill them in using data on the wall map.
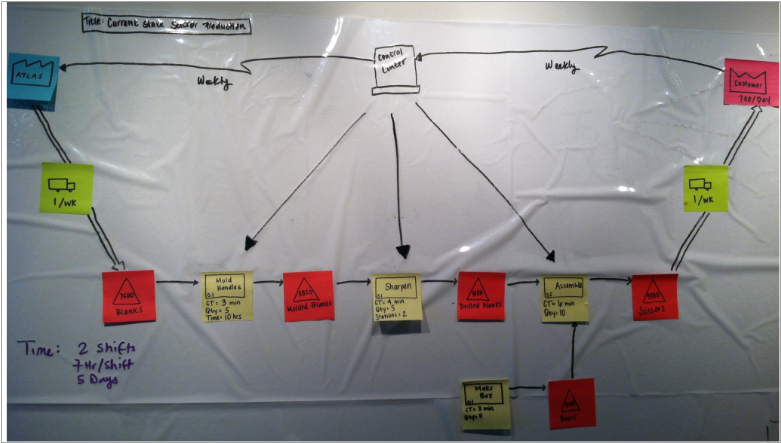
Here's an example. Starting with a map we drew on some Smart Sheets; below, we've imported and scaled the image:
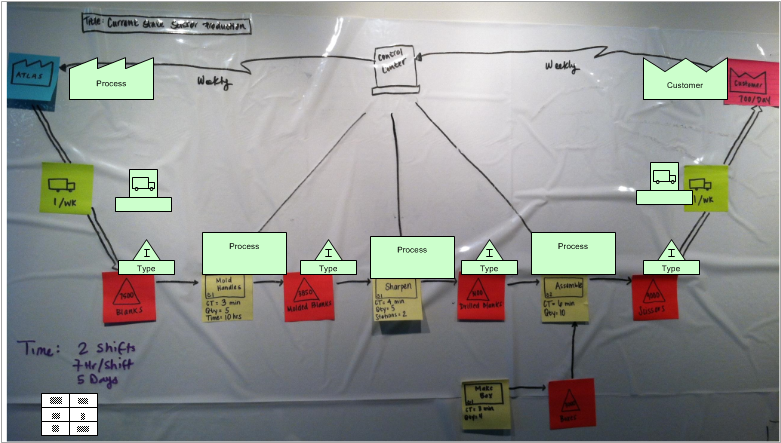
Next, we have dragged process blocks from the Sketch Manufacturing stencil:
We then went step-by-step through the map, right-mouse clicking on each process block and selecting 'Add Data (shape)', which just adds the appropriate data blocks to the green shapes. We usually just move the green shape out of the way of the image behind, fill in the data we can get from the image, then move the green shape back over its corresponding part of the image.
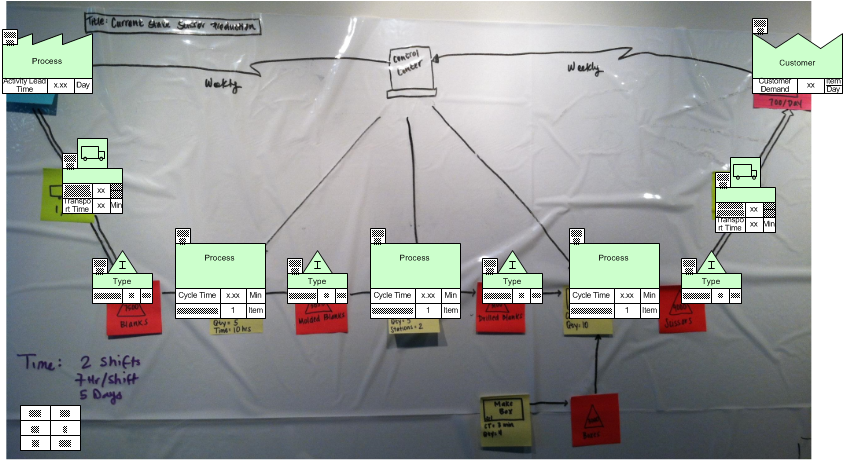
We do let you add all the data for the entire page in the same right-mouse menu on any of the green shapes, but we typically do one at a time as a way of tracking our progress in filling in the data.
I hope you'll give wall map capture a try in eVSM, because it's a fast and easy way to make your wall maps electronic, which is just a step away from being able to use eVSM to calculate metrics on your map, make visual plots to help identify problems, and then plan out your improvement projects. If you don't have eVSM, give it a try, and if you do have eVSM, this tool has been in place since eVSM v7, so there's a good chance it's there waiting for you to give it a shot.