In part 1 I talked about a very simple way to move data from Excel into eVSM. This method is very limited because none of the cycle times or demands or any other process data gets imported, just the name of the step/block.
Excel Data Input
In this part, I'm going to talk about a feature that's been in beta testing at eVSM for several years, but never exposed to users. This feature allows you to input data in Excel that will add new centers to the map, including any variable data you have for them. It also lets you modify data for existing centers on your map.
This should be a very powerful addition to your VSM event workflow. Imagine your improvement team has just completed drawing a current state wall map using post-it notes, and now you want to analyze the value stream and do some what-if analysis on potential changes. You can quickly capture each step in Excel, including whatever data you have, and with a single click have all that data transferred into eVSM. If you use the Wall map import tool then you can very quickly position all the new centers in eVSM. Compared to doing this manually, even in a fast, user-friendly tool like eVSM, you're looking at tripling your productivity in digitizing your map, spending less time at the computer and more time improving.
How to use it
Because eVSM includes many stencils for drawing different types of maps, we can't simply provide an Excel import format that includes the input data for all the different types of centers and maps. Instead we have a button called 'Create XL', which will create an Excel worksheet for the current page you have open, tailored automatically to the stencil you're currently using (i.e. so it'll have the inputs for Manufacturing maps rather than Transactional).
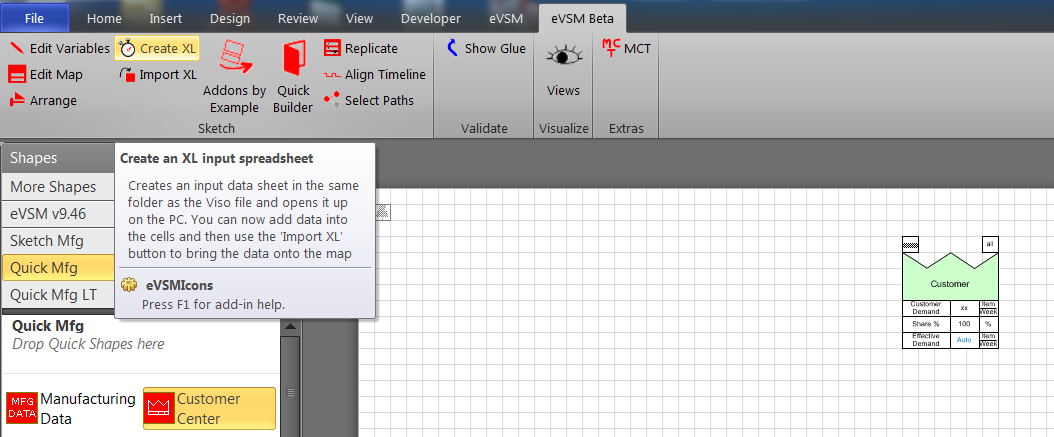
To get started, I've dropped out a Time Center and a Customer Center to a new page, and have the mouse hovering over the 'Create XL' button (more on that button location below). In v9 (and later), you have to have at least one 'Center' on the page, or the 'Create XL' button won't proceed to build the worksheet. This is fixed in v10, to allow you to create all your centers via Excel input.
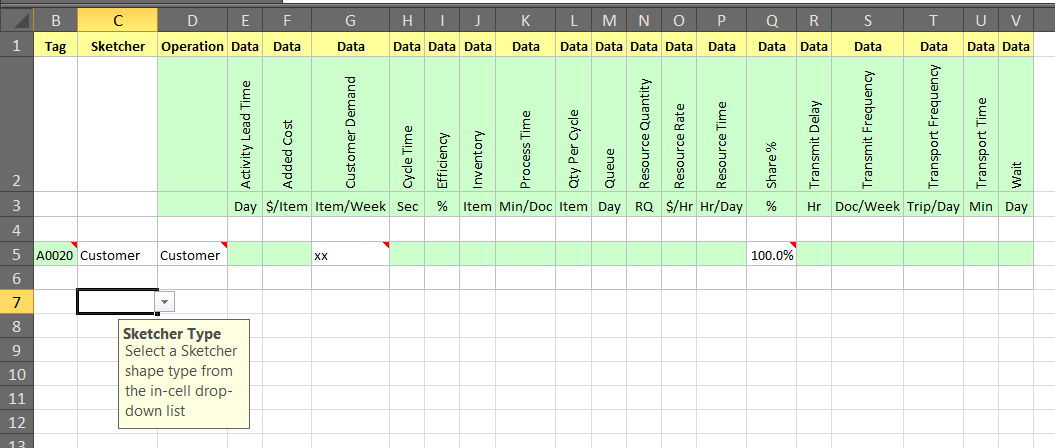
The above image shows what the Excel worksheet looks like, which is very similar to when you click the Solve button. However, there's a new column called Sketcher, which notes the type of center that row represents. We use Excel conditional formatting to shade cells green where you don't need to input any data. The white cells are the ones that need inputs for any given row.
We also allow you to create new centers on the map, starting one row below the bottom of the existing data (row 7 in the image above). You can click on the dropdown in column C and get a list of the available center types you can add:
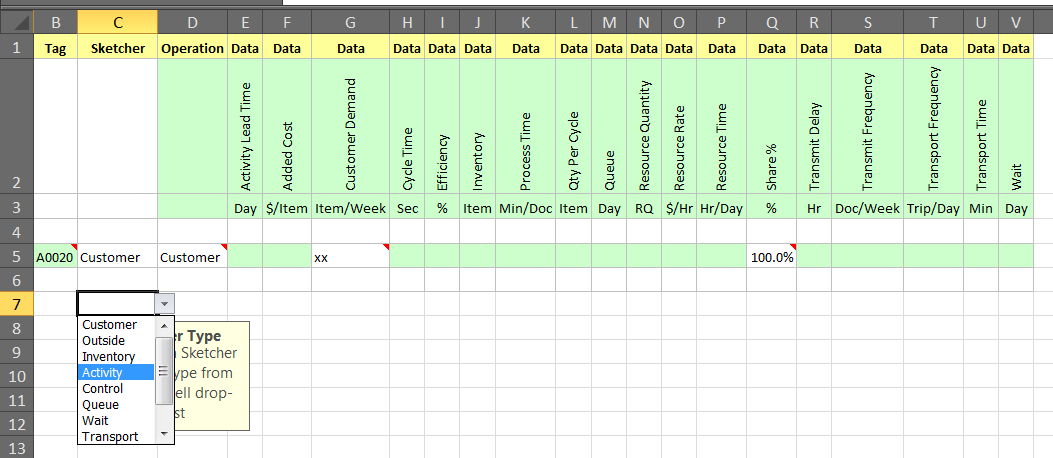
Once you pick an item from that list, we highlight the columns where input data is allowed:
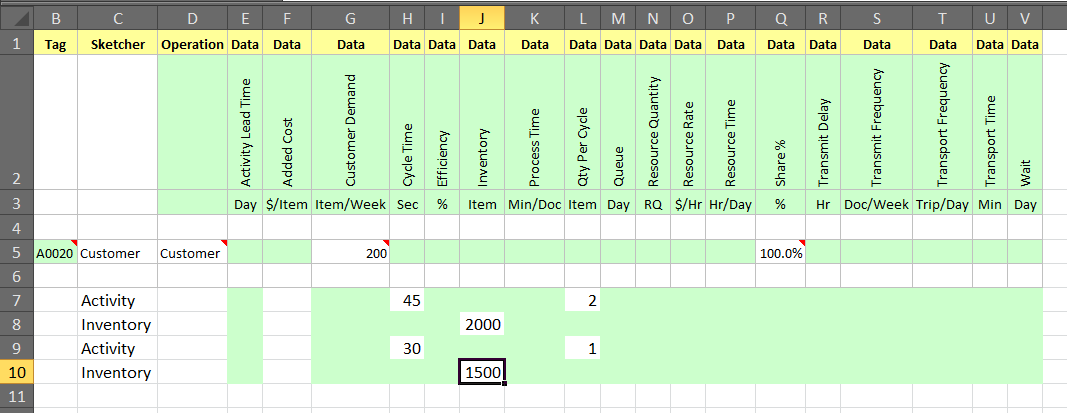
From there you can fill in the input data you have, and leave out the ones you don't have yet. Note that you have to have the input values matching the unit in row 3 for any particular variable column. You can easily change units once the data is in eVSM. Once you've finished populating data for new and existing rows, you can go back to eVSM and click the 'Import XL' button:
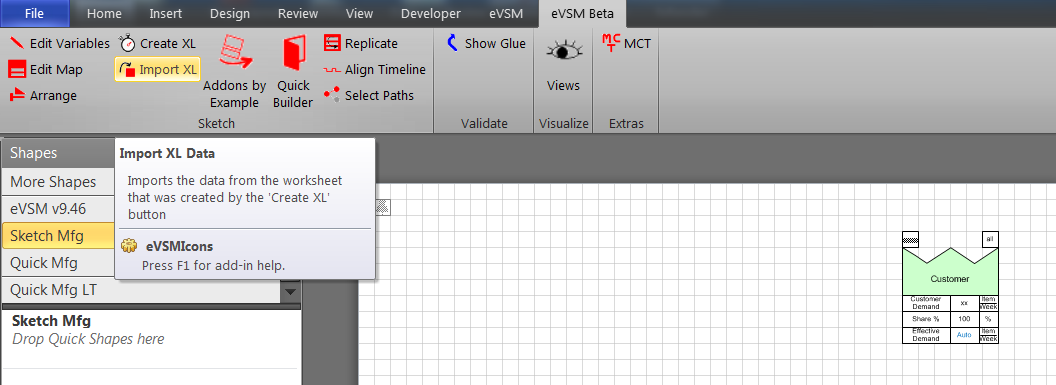
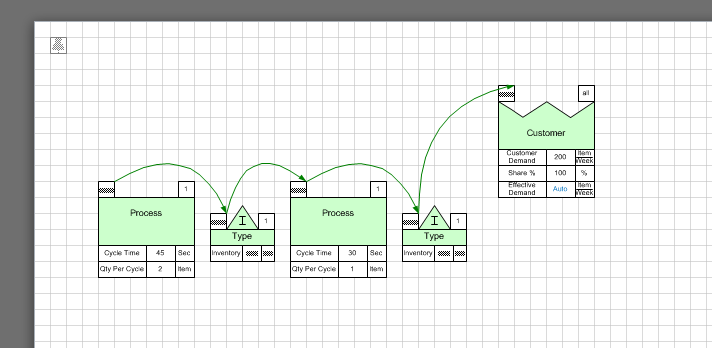
and eVSM will read that worksheet to fill out the data for existing centers, and create any new centers as needed:
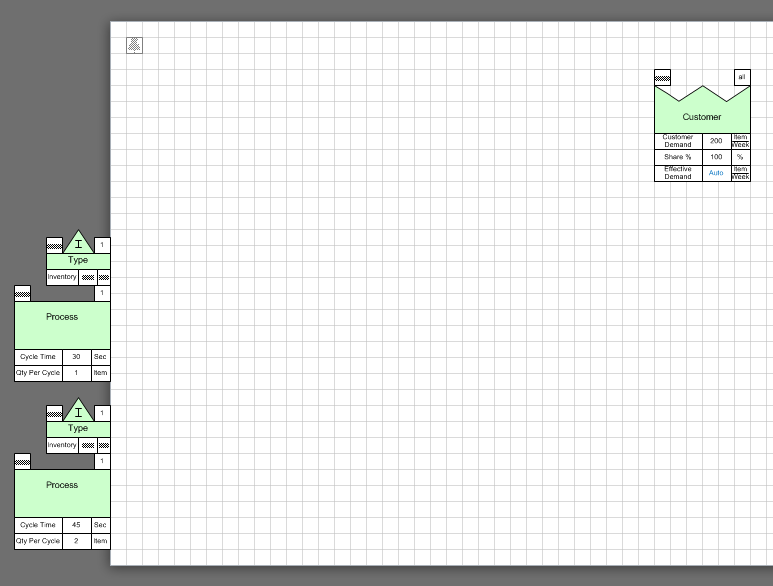
Since eVSM doesn't know where you want them (and that's hard to specify in a spreadsheet), we stack them up vertically starting at the bottom left corner of your map. You can just click and drag the green shape to position a center on the map, and if necessary ctrl+select them in sequence and use the Auto Sequence button to connect them into the map: