
The book "Learning To See" (Rother & Shook) published a couple of decades ago is a fantastic intro to the value stream mapping process and its fit within the lean methodology. Millions have benefited from this, myself included. This blog looks at the case study in the book recreates the value stream map digitally with eVSM Mix and includes some variations that are commonly encountered in mixed model value streams. It shows how eVSM mixed model maps make key "what-ifs" easy and help the improvement effort.
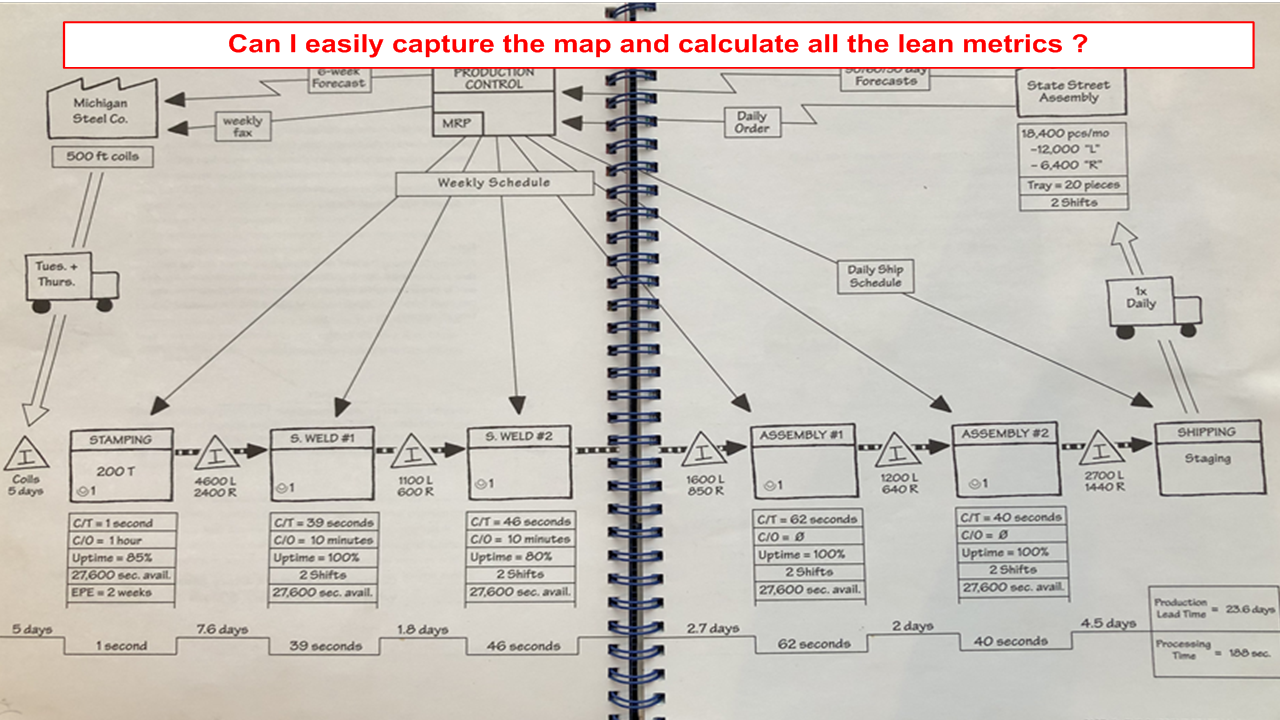
We can use the eVSM Mix software to capture the current state map (shown above) from the book, do the related analytics, and draw Utilization and CT/TT charts. Let's discuss the resulting map..
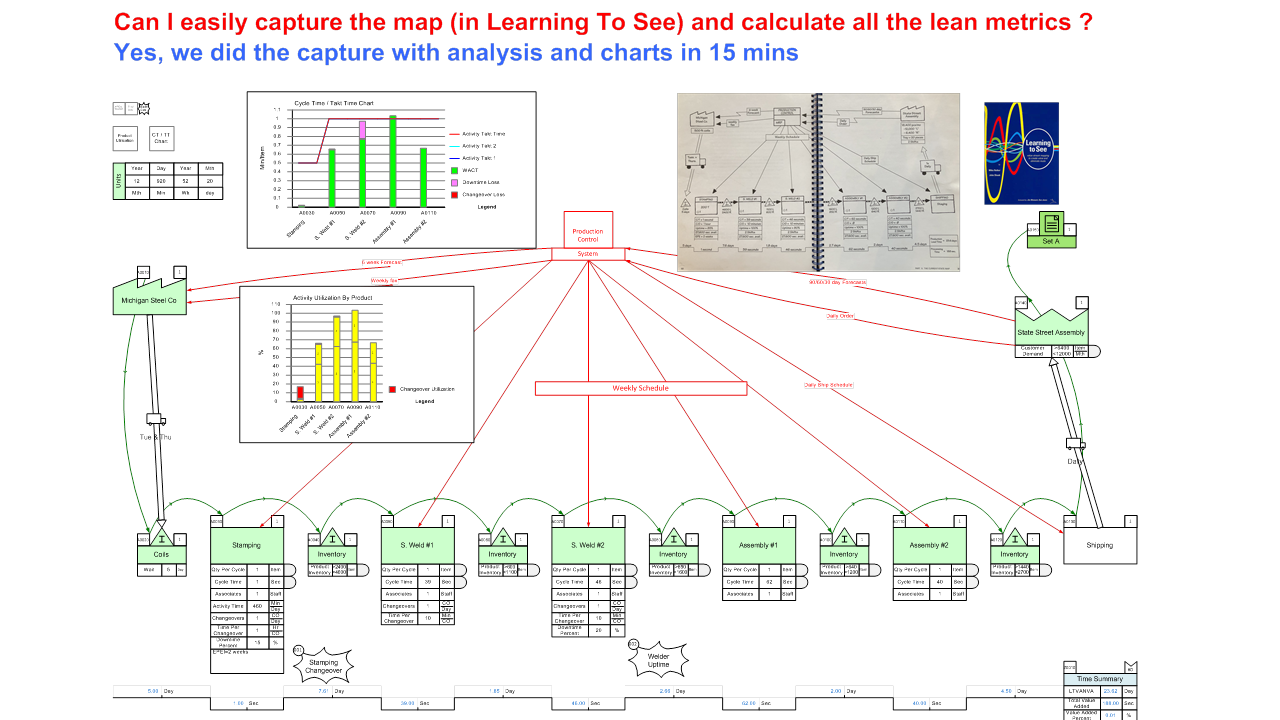
The map capture took 15 mins, including calculating the lean metrics and the cycle time/takt time chart. Getting to that point manually would take several hours. Imagine how much more Lean practitioners and VSM teams could get done. However, let's recognize that the case study map in the book is educational, so it's simple by design. What about the complexities you would find in real-life mixed model value streams, like different product routings and different product cycle times? eVSM Mix handles these situations routinely! Let's look at different product routings first...
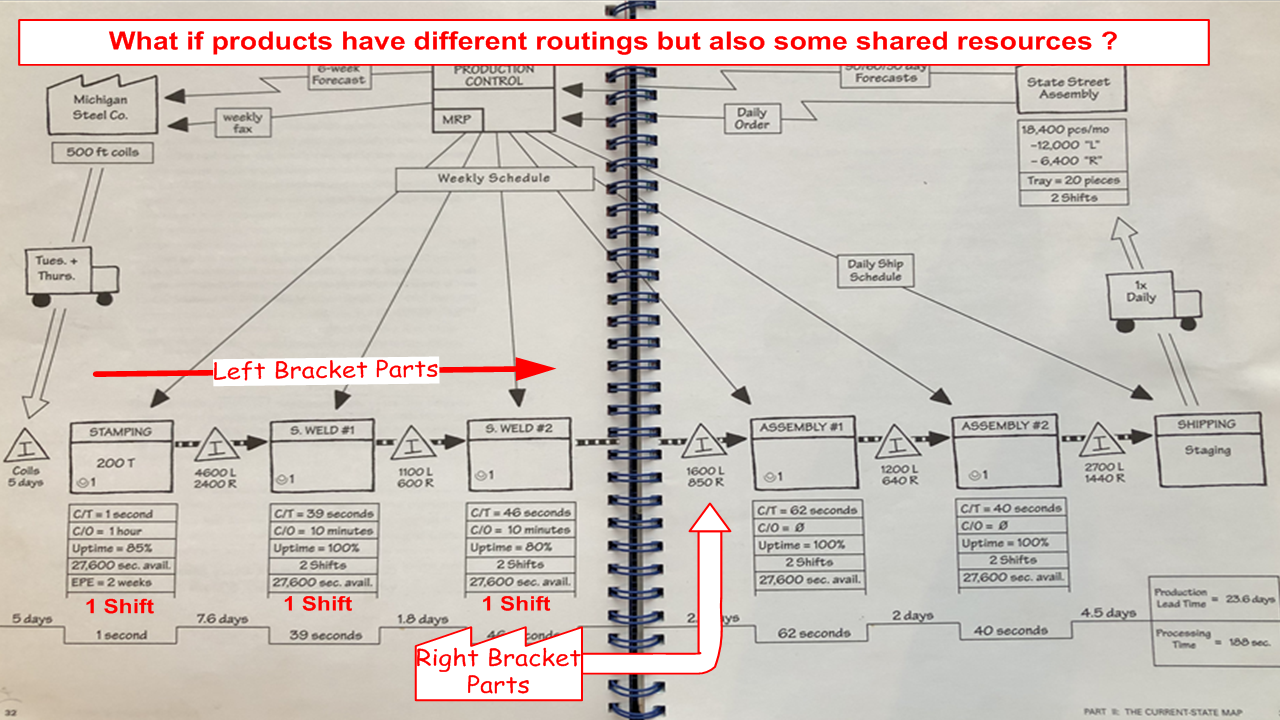
Let's suppose we want to do a “what-if” on outsourcing the right bracket parts and moving the operations upstream of assembly to a single shift as shown in the diagram above. So the right bracket and left brackets have different routings now.
Lets see how this is handled in eVSM Mix.
Lets see how this is handled in eVSM Mix.
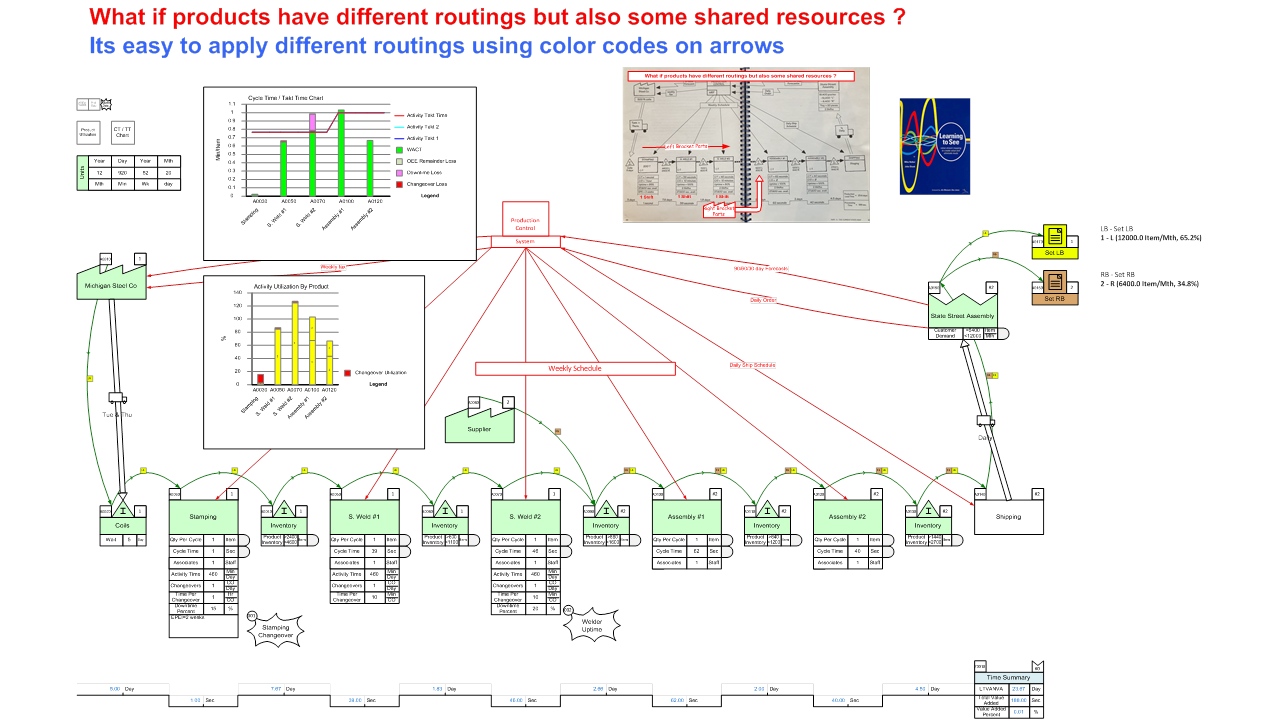
The software allows routing variation in a color-coded fashion. You can see the route colors on the arrows in the map above. The yellow route is followed by the right brackets and the brown by the left brackets. Solving the map and looking at the station utilization chart shows that the second welder station will be a bottleneck if it operates on only one shift.. Products can also have different cycle times (and other operational values) through shared resources. Lets look at that next..
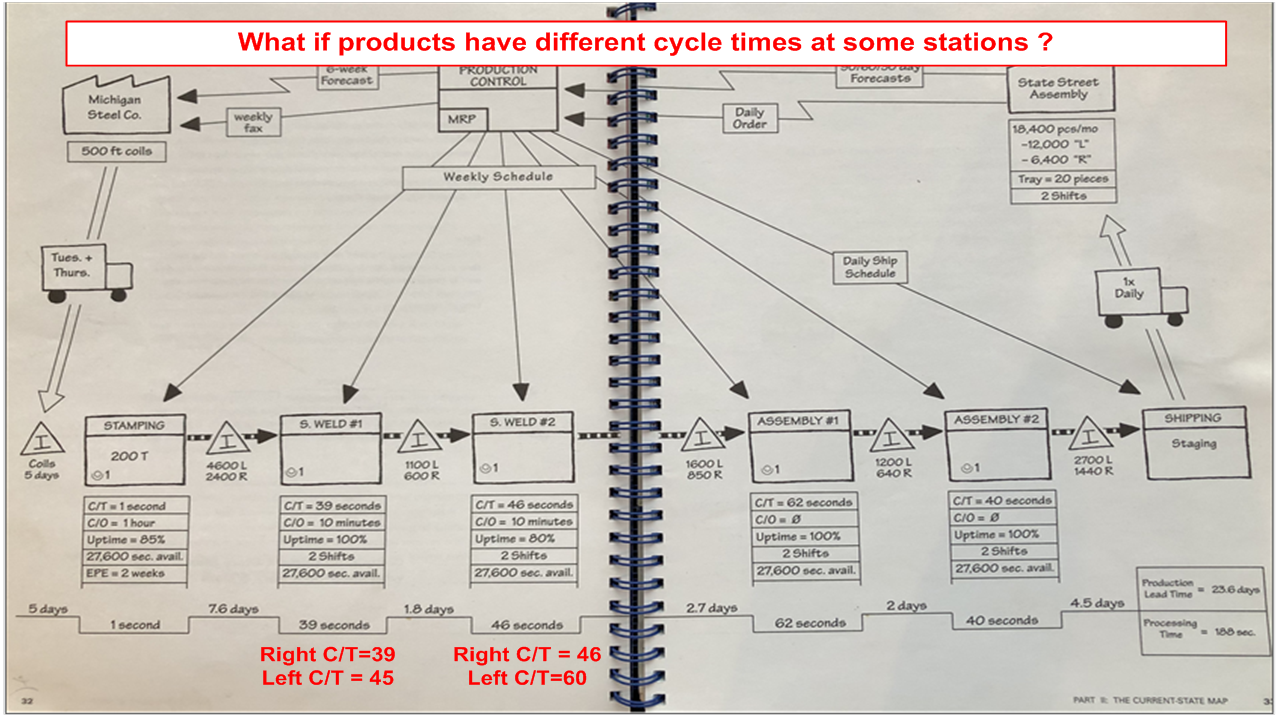
In our example above, suppose the geometry makes the welding operations take longer for the left bracket. You can see the different cycle times marked up on the map in red. Let's see how this is handled in eVSM.
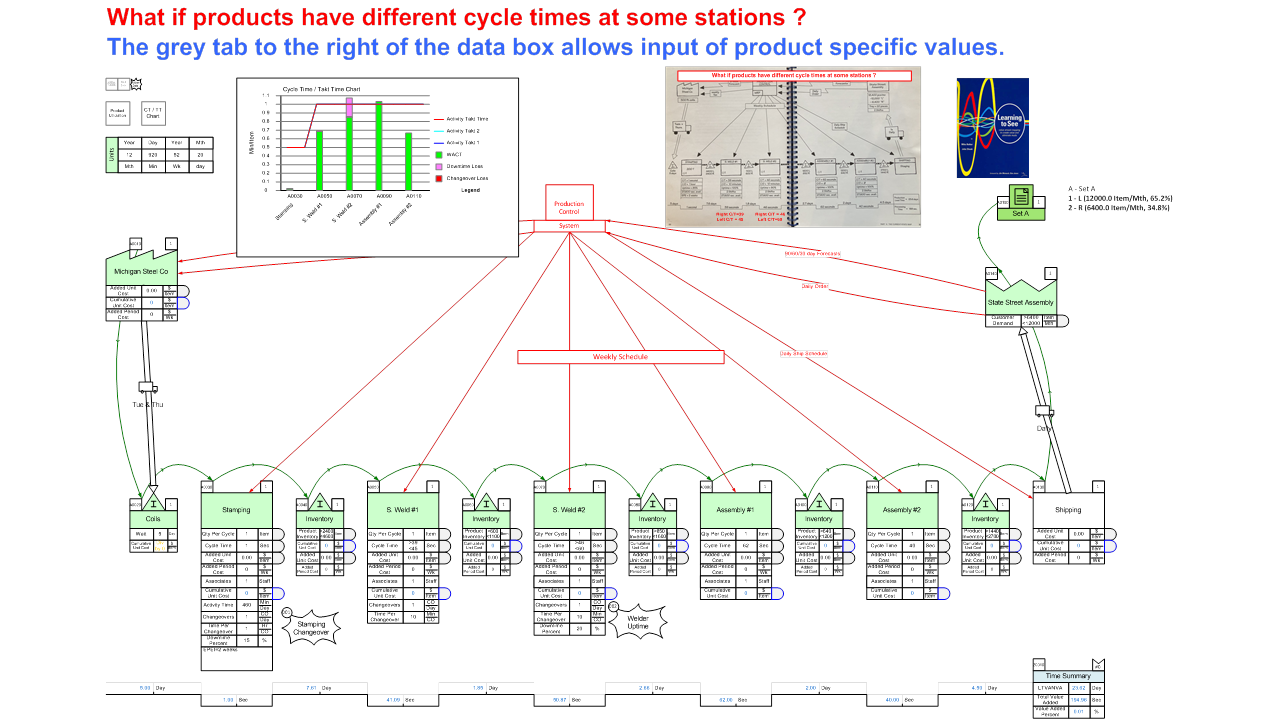
This scenario is easily handled in eVSM Mix because it allows for variation in operational values for products at each station. Data boxes have a tab on the right to allow specification of product specific values when needed. This ability to specify differences in operational values gives us a better feel for capacity and lead time in the value stream.
In the case study, there is an assumption of dedicated staff at each station. What if we wanted to share a resource pool across stations for increased efficiency? Let's look at the handling of that in eVSM..
In the case study, there is an assumption of dedicated staff at each station. What if we wanted to share a resource pool across stations for increased efficiency? Let's look at the handling of that in eVSM..
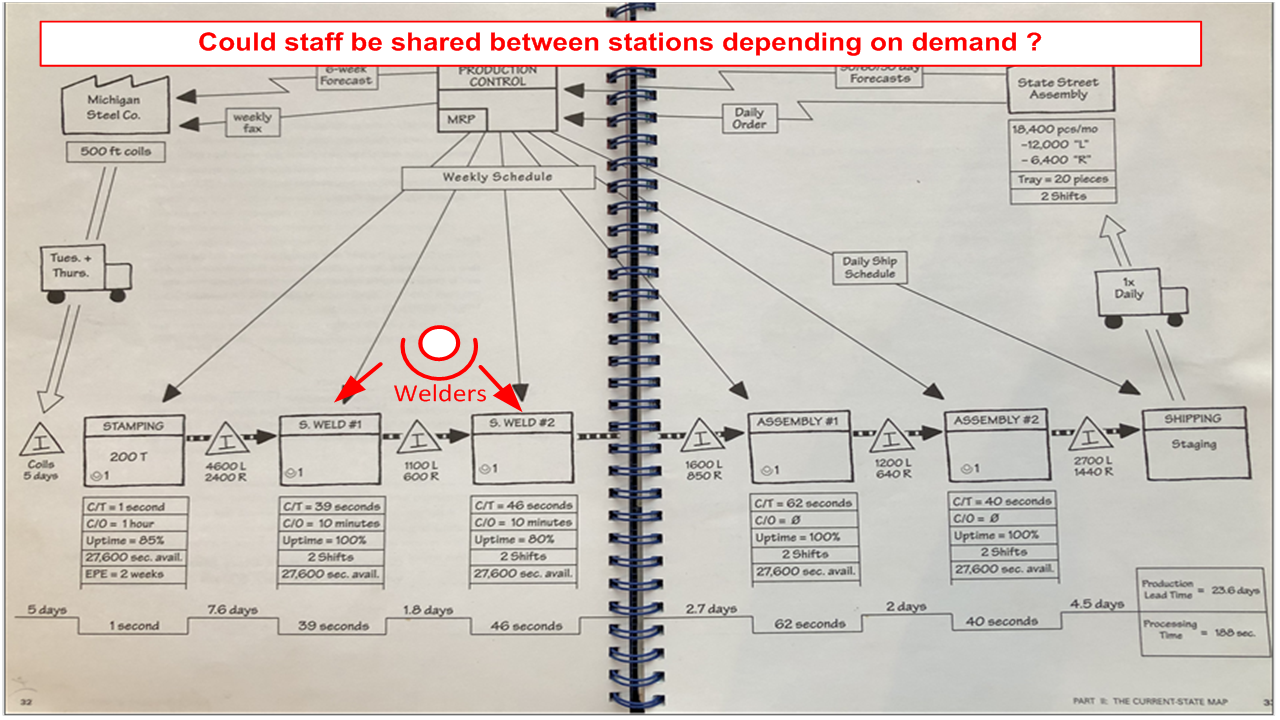
In the case study suppose we are considering cross-training the welders so they can perform either of the two welds. How many welders do we need to meet demand ?. Lets see how this is handled in eVSM Mix..
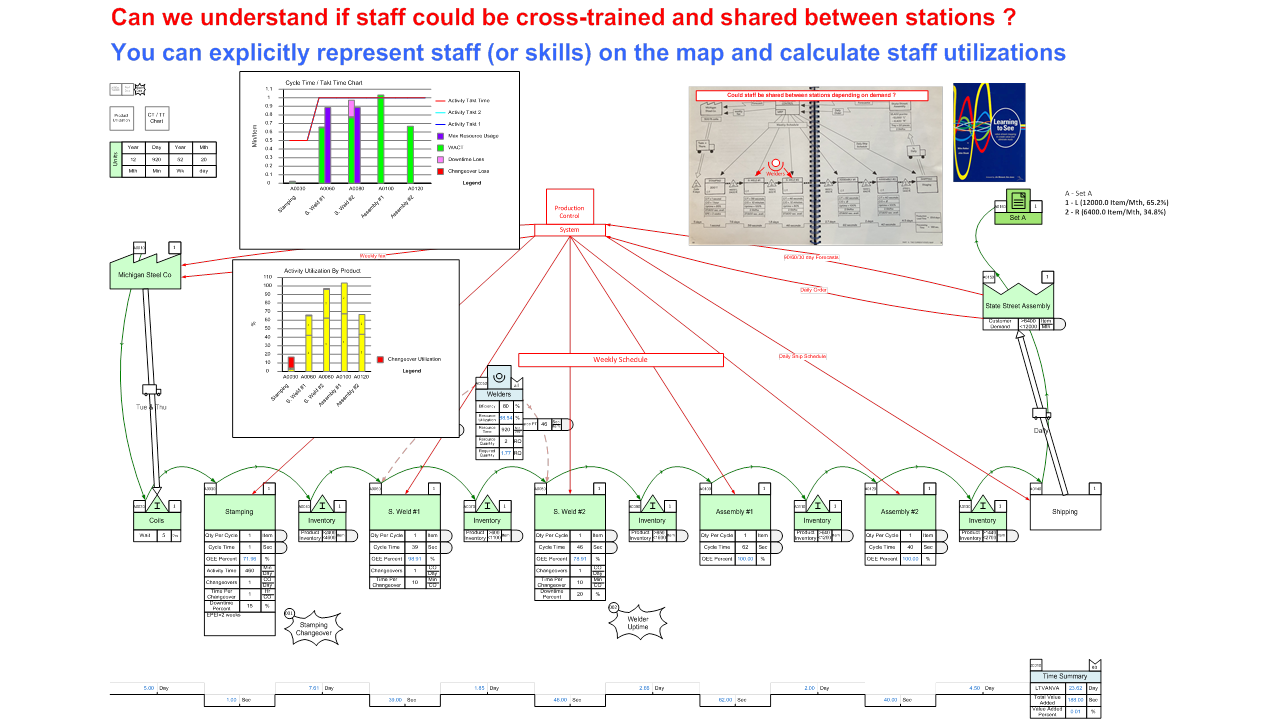
In the map above you can see the welder resource is explicitly added on the map and is piped into the activities that require it. eVSM carries out a resource utilization calculation based on this. Its about 90% for this example. We have set welder efficiency at 80% to account for unexpected downtime at the stations.
eVSM Mix is a step change in usability and leverage of value stream maps in a lean deployment. Email support@evsm.com and request a one-on-one conference to help you leverage this low-cost but highly effective software in your production environment.